Methodology
Updated GSB Methodology
November 2023 update.
Building Nasdaq swing systems on 23 hour data, 5.5 days a week.
Big picture. June 10 2021 update
GSB methodology is constantly improving, and more effort is spend on this than almost anything else.
The most recent methodology always better then the older material, but the older material is the foundation of the newer material.
You cant understand the newer methodology without understanding the older methodology.
So most recent is ES/NQ/YM systems
then Gold (see videos on gold)
then Crude oil. However to understand the most recent, you need to look at the foundation of the older material.
GSB is powerful, but that makes it complex. This is a lot to learn, but there is support to help you.
Ref: YouTube video posted 26 Nov 2019 https://youtu.be/6bPAvyMXIwA
Note the Gold videos are more recent, and a better place to start than CL. Gold is well described in the videos, but not in this help file document.
Contents
Part A. Establish a Baseline. Details below are now absolute, but its worth a quick read. Refer to newer documentation shown above.
Step 1. Build 50,000 systems
Step 2. Get the performance details for the top 250
Step 3. Get the performance stats for top 90 Astab-C
Step 4. Get the performance stats for the top 91 VSS
Step 5. Record the baseline performance stats in a spreadsheet
Part B. Identify Indicators that provide a better result
Build 20,000 systems
Pick the top 10,000 systems
Part C. Build systems with reduced indicator set and compare to baseline
Step 1. Build 50,000 systems
Step 2. Get the performance details for the top 250
Step 3. Get the performance stats for top 90 Astab-C
Step 4. Get the performance stats for the top 91 VSS
Step 5. Record the baseline performance stats in a spreadsheet
Part D. Optional - Identify best normalization modes, number of indicators, other data streams etc
Step 1. Build 50,000 systems
Step 2. Get the performance details for the top 250
Step 3. Get the performance stats for top 90 Astab-C
Step 4. Get the performance stats for the top 91 VSS
Step 5. Record the baseline performance stats in a spreadsheet. If base line has improved use these settings.
Part E. Select the best individual systems to trade
Pick whichever approach gave the highest performance statistics;
Create Families
Pick the top families and the top member of the family (first entry)
WF strategy again
Check equity curve is positive on remaining out of sample period.
Part A. Establish a Baseline
Step 1. Build 50,000 systems using GSB Manager. (10,000 or less used in later testing)
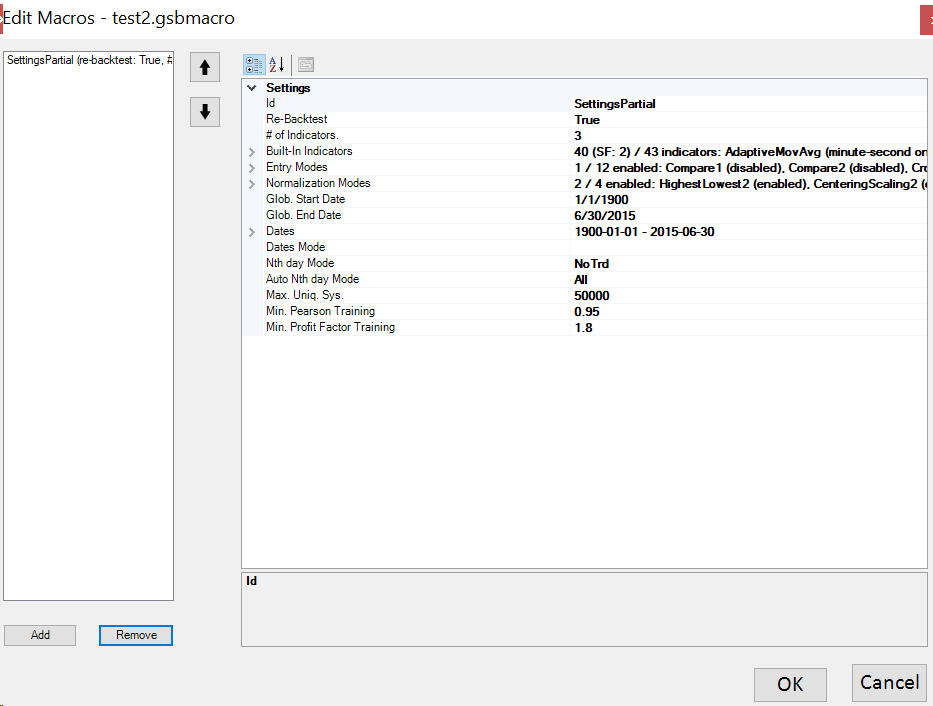
Use settings as per the video. In GSB 56.16, then can now be done with settings-partial macro. This assumes the other settings are on the defaults from Nov 2019. IE Entry Level mode & weight mode on SignPower
Step 2. Get the performance details for the top 250
Run Macro 1:
- Add favorites A,B,C,D
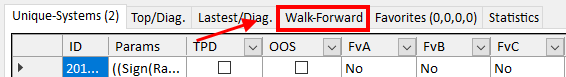
- Walk forward top 250 systems (based om F-F) out of the 50,000
Verify Systems:
- Verify the 250 walk forwarded systems with data that has random noise added to it
- 8 data streams - 4 with 5 ticks of noise and 4 with 10 ticks of noise
Once 250 walk forwarded systems are verified the user must put stats are put into Fav D. This is done by going to the WF tab with all 250 systems, selecting them all (control a), right click, add to favorites.
Then run Macro 3 from the Walk-forward tab: This does the following.
- put stats into Stats A-F
- 2000-2015 Non WF
- 2000-2015 WF
- 2015-2018 Non WF
- 2015-2018 WF
- 2018-2019 Non WF
- 2018-2019 WF
Step 3. Get the performance stats for top 90 Astab-C
Run Macro 5, This does the following.
- Take top 90 Anchored Stability Course of the top 250 systems
- will put 90 systems into Fav D
Run Macros 3
- Put stats into Stats A-F
- 2000-2015 Non WF
- 2000-2015 WF
- 2015-2018 Non WF
- 2015-2018 WF
- 2018-2019 Non WF
- 2018-2019 WF
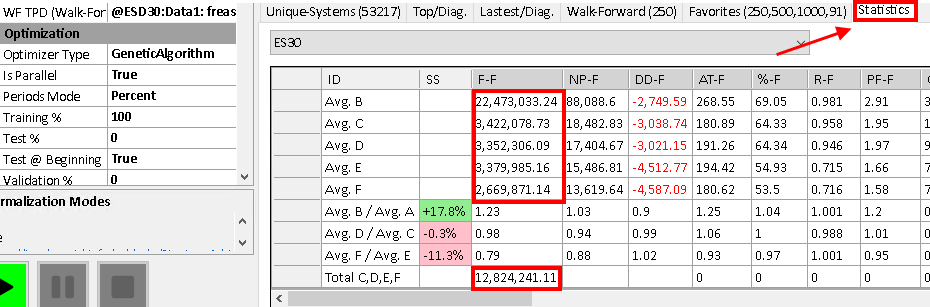
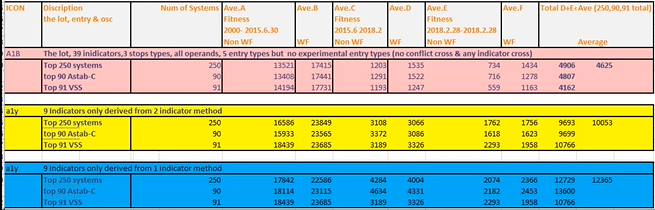
Below is an example of the statistics tab.Note the numbers used in red are divided by 1000.
Step 4. Get the performance stats for the top 91 VSS
Run Macro 6, This does the following.
- Take the top 91 of systems from the 250 WF systems
Run Macro 3
- Put stats into Stats A-F
- 2000-2015 Non WF
- 2000-2015 WF
- 2015-2018 Non WF
- 2015-2018 WF
- 2018-2019 Non WF
- 2018-2019 WF
Step 5. Record the baseline performance stats in a spreadsheet
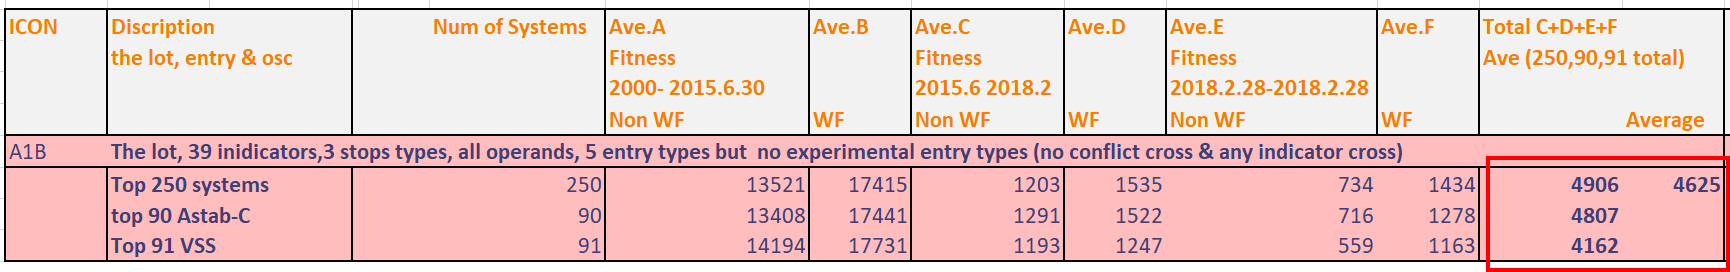
Note the 4625 above is done in excel. It is the average of (4906,4807,4162)
Part B. Identify Indicators that provide a better result
Build 20,000 systems
Use settings as per the video, Note this is using 1 indicator
Pick the top half (10,000)
Sort by F-F (click the F-F coulomb)
Scroll down and pick the top 10,000
Add to Fav A
Select All Fav A
Save Parameter Performance
Pick the top 9-11 indicators
Part C. Build systems with reduced indicator set and compare to baseline
Step 1. Build 50,000 systems
Use settings as per the video. Settings are identical to 1.1 except 9 to 12 indicators are used,
Step 2. Get the performance details for the top 250
Run Macro 1:
- Add favorites A,B,C,D
- Walk forward top 250 systems (based om F-F) out of the 50,000
Verify Systems:
- Verify the 250 walk forwarded systems with data that has random noise added to it
- 8 data streams - 4 with 5 ticks of noise and 4 with 10 ticks of noise
Once 250 walk forwarded systems are verified the stats are put into Fav D
Then run Macro 3:
- This puts stats into Stats A-F
- Format below is yyyymmdd
- 20000101-20150630 Non WF (Fav A)
- 20000101-20150630 WF (Fav b)
- 20150701-20180228 Non WF (Fav C)
- 20150701-20180228 WF (Fav D)
- 20180301-20190228 Non WF (Fav E)
- 20180301-20190228 WF (Fav F)
Step 3. Get the performance stats for top 90 Astab-C
Run Macro 5
- Take top 90 Anchored Stability Course of the top 250 systems
- will put 90 systems into Fav D
Run Macros 3
- This puts stats into Stats A-F
- 20000101-20150630 Non WF (Fav A)
- 20000101-20150630 WF (Fav b)
- 20150701-20180228 Non WF (Fav C)
- 20150701-20180228 WF (Fav D)
- 20180301-20190228 Non WF (Fav E)
- 20180301-20190228 WF (Fav F)
Step 4. Get the performance stats for the top 91 VSS
Run Macro 6
- Take the top 91 of systems from the 250 WF systems
Run Macro 3
- This puts stats into Stats A-F
- 20000101-20150630 Non WF (Fav A)
- 20000101-20150630 WF (Fav b)
- 20150701-20180228 Non WF (Fav C)
- 20150701-20180228 WF (Fav D)
- 20180301-20190228 Non WF (Fav E)
- 20180301-20190228 WF (Fav F)
Step 5. Record the baseline performance stats in a spreadsheet
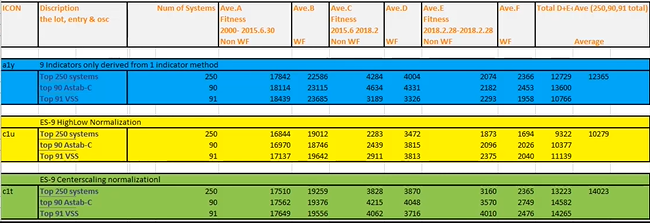
Part D. Optional - Identify best normalization modes, number of indicators, secondary data streams, Entry types etc
Note Dec 21 2019. Entry type for S&P 500 is likely to be crossover dual. For Crude oil it is compare2. Likely these are the best two entry types. Note however that compare2 works badly on S&P 500 & crossover worked poorly on Crude oil.
Step 1. Build 50,000 systems
Using the settings from the video and the best indicators from Part C, run individual tests with each normalization mode to see which produces the best results.
Use settings as per the video
Step 2. Get the performance details for the top 250
Run Macro 1:
- Add favorites A,B,C,D
- Walk forward top 250 systems (based om F-F) out of the 50,000
Verify Systems:
- Verify the 250 walk forwarded systems with data that has random noise added to it
- 8 data streams - 4 with 5 ticks of noise and 4 with 10 ticks of noise
Once 250 walk forwarded systems are verified the stats are put into Fav D
Then run Macro 3:
- This puts stats into Stats A-F
- 20000101-20150630 Non WF (Fav A)
- 20000101-20150630 WF (Fav b)
- 20150701-20180228 Non WF (Fav C)
- 20150701-20180228 WF (Fav D)
- 20180301-20190228 Non WF (Fav E)
- 20180301-20190228 WF (Fav F)
Step 3. Get the performance stats for top 90 Astab-C
Run Macro 5
- Take top 90 Anchored Stability Course of the top 250 systems
- will put 90 systems into Fav D
Run Macros 3
- This puts stats into Stats A-F
- 20000101-20150630 Non WF (Fav A)
- 20000101-20150630 WF (Fav b)
- 20150701-20180228 Non WF (Fav C)
- 20150701-20180228 WF (Fav D)
- 20180301-20190228 Non WF (Fav E)
- 20180301-20190228 WF (Fav F)
Step 4. Get the performance stats for the top 91 VSS
Run Macro 6
- Take the top 91 of systems from the 250 WF systems
Run Macro 3
- This puts stats into Stats A-F
- 20000101-20150630 Non WF (Fav A)
- 20000101-20150630 WF (Fav b)
- 20150701-20180228 Non WF (Fav C)
- 20150701-20180228 WF (Fav D)
- 20180301-20190228 Non WF (Fav E)
- 20180301-20190228 WF (Fav F)
Step 5. Record the baseline performance stats in a spreadsheet
Part E. Select the best individual systems to trade
Pick whichever approach gave the highest performance statistics;
Select the best results from Favorites D.
- The 90 Astab-C or
- the 91 VSS
For example, if you did VSS last, but astab-C had higher metrics, run macro5 to add 90 top systems into favorites D.
Create Families. Done by right clicking the systems in favorites D
Pick the top families and the top member of the family (first entry)
WF strategy again
Not shown in video but you may choose to WF this strategy again to 28 Feb 2019.
This gives you another 8 months + of OOS which hopefully provides positive results