Building Nasdaq, S&P500 or Dow systems
There 3 markets are build in almost the same way, but with subtle differences.
We will start with the Nasdaq. We are NOT using GSB AUtomation in this example. GSB Automation is much simpler, especially when you want to do this multiple times.
This document is talking more about the practicalities of building trading systems, than the theory behind it.
UPDATED July 22 2022
The following improvements have been made
i. Macros that put the best systems in Favorites C ,D as well as A,B
The performance filters get tighter, so the best systems (and less of them) will be in favorites D
ii. Change of dates. We start at 1.1.2007 and out of sample starts Feb 28 2007. No data is used after Feb 28 2021 which gives > 1year still seen as out of sample.
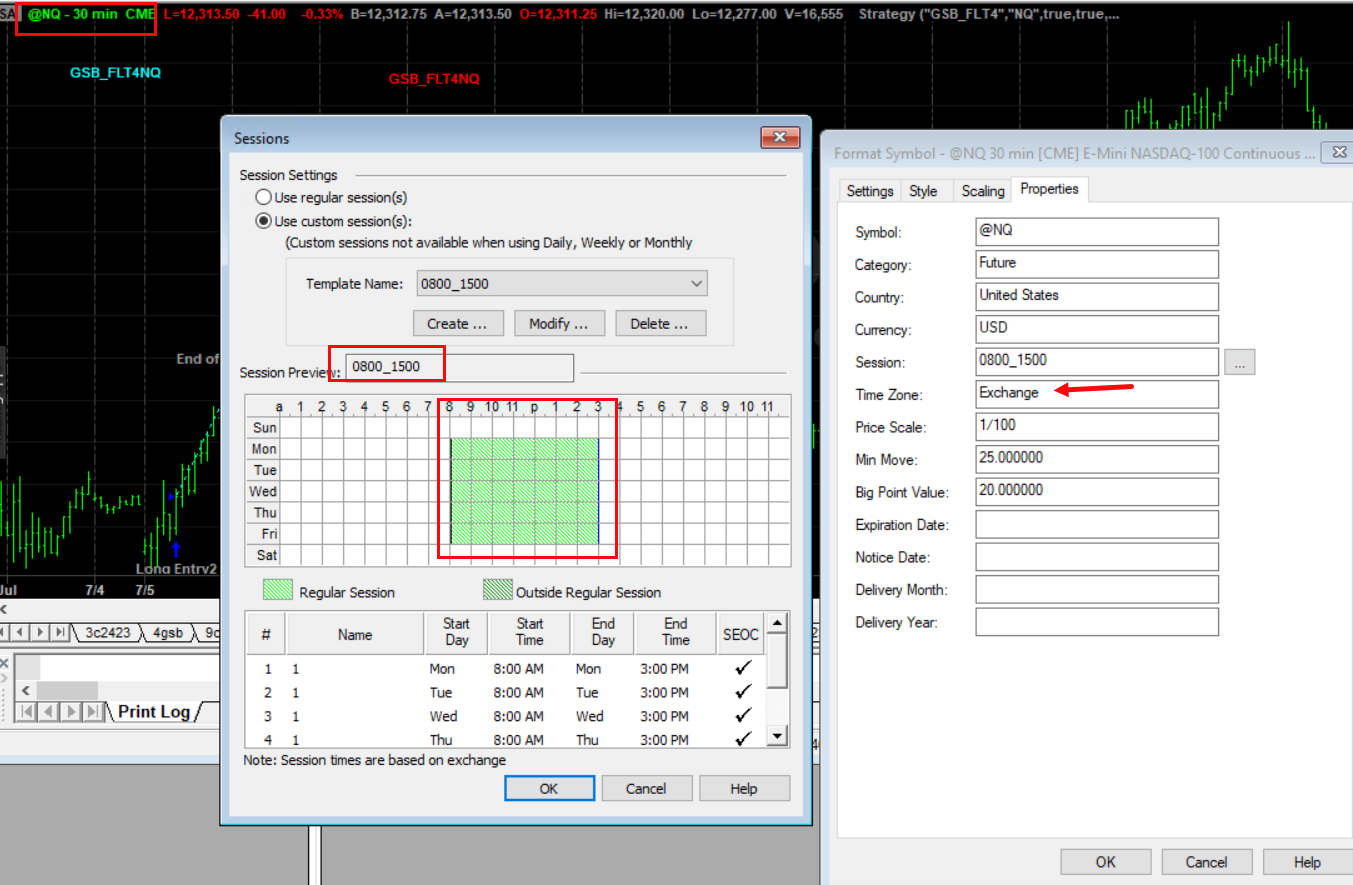
iii. Change of session times. Our data now starts at 8.00 am instead of 8:30 am. This now means we use symbol @ES NOT @ES.D
iv) Change of earliest time of day a trade can occur. This is now 9:00 am. iii & IV were found with extensive testing using GSB Automation.
Users who contributed to their workers to this research received a detailed breakdown of these results with some additional tips.
v) Change of dates for in & out of sample periods.
Statistics A Has the in sample metrics 2007-Jan-01 to 2017-Feb-28
Statistics B has out of sample metrics 2017-Mar-01 to 2018-Feb-28
Statistics C has out of sample metrics 2018-Mar-01 to 2019-Feb-28
Statistics D has out of sample metrics 2019-Mar-01 to 2020-Feb-28
Statistics E has out of sample metrics 2020-mar-01 to 2021-Feb-28
Statistics F has out of sample metrics 2017-mar-01 to 2021-Feb-28 (the entire out of sample period)
vi) A different set of indicators have been chosen in the June 2022 update.
To be continued by the end of July 2022
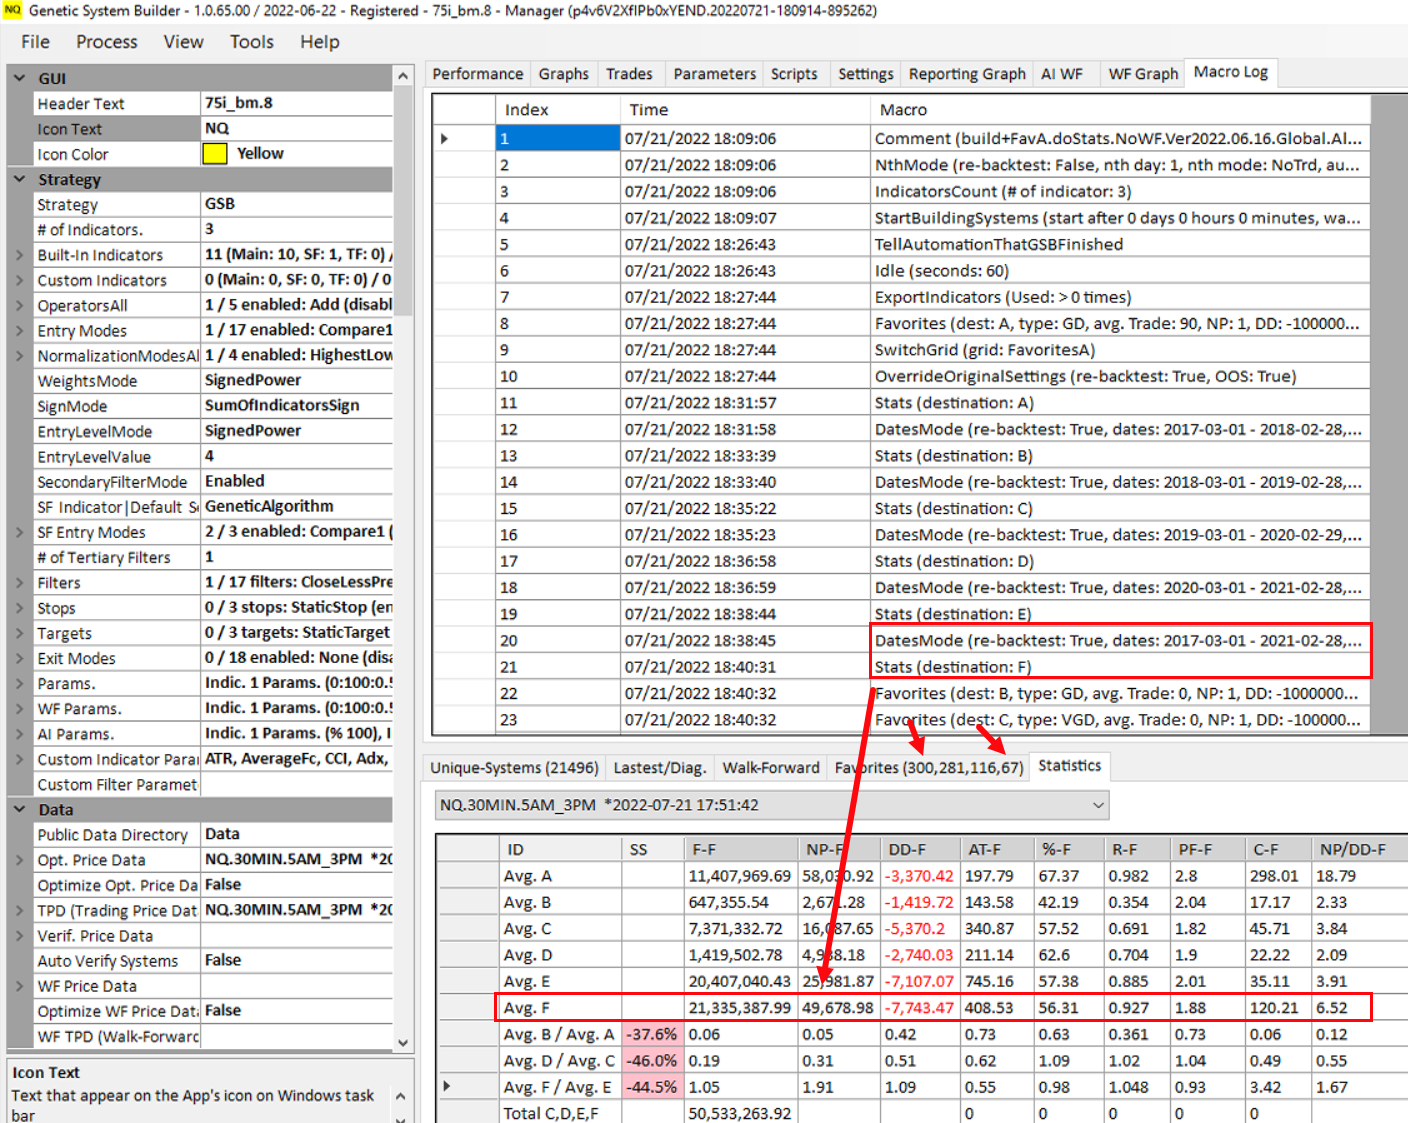
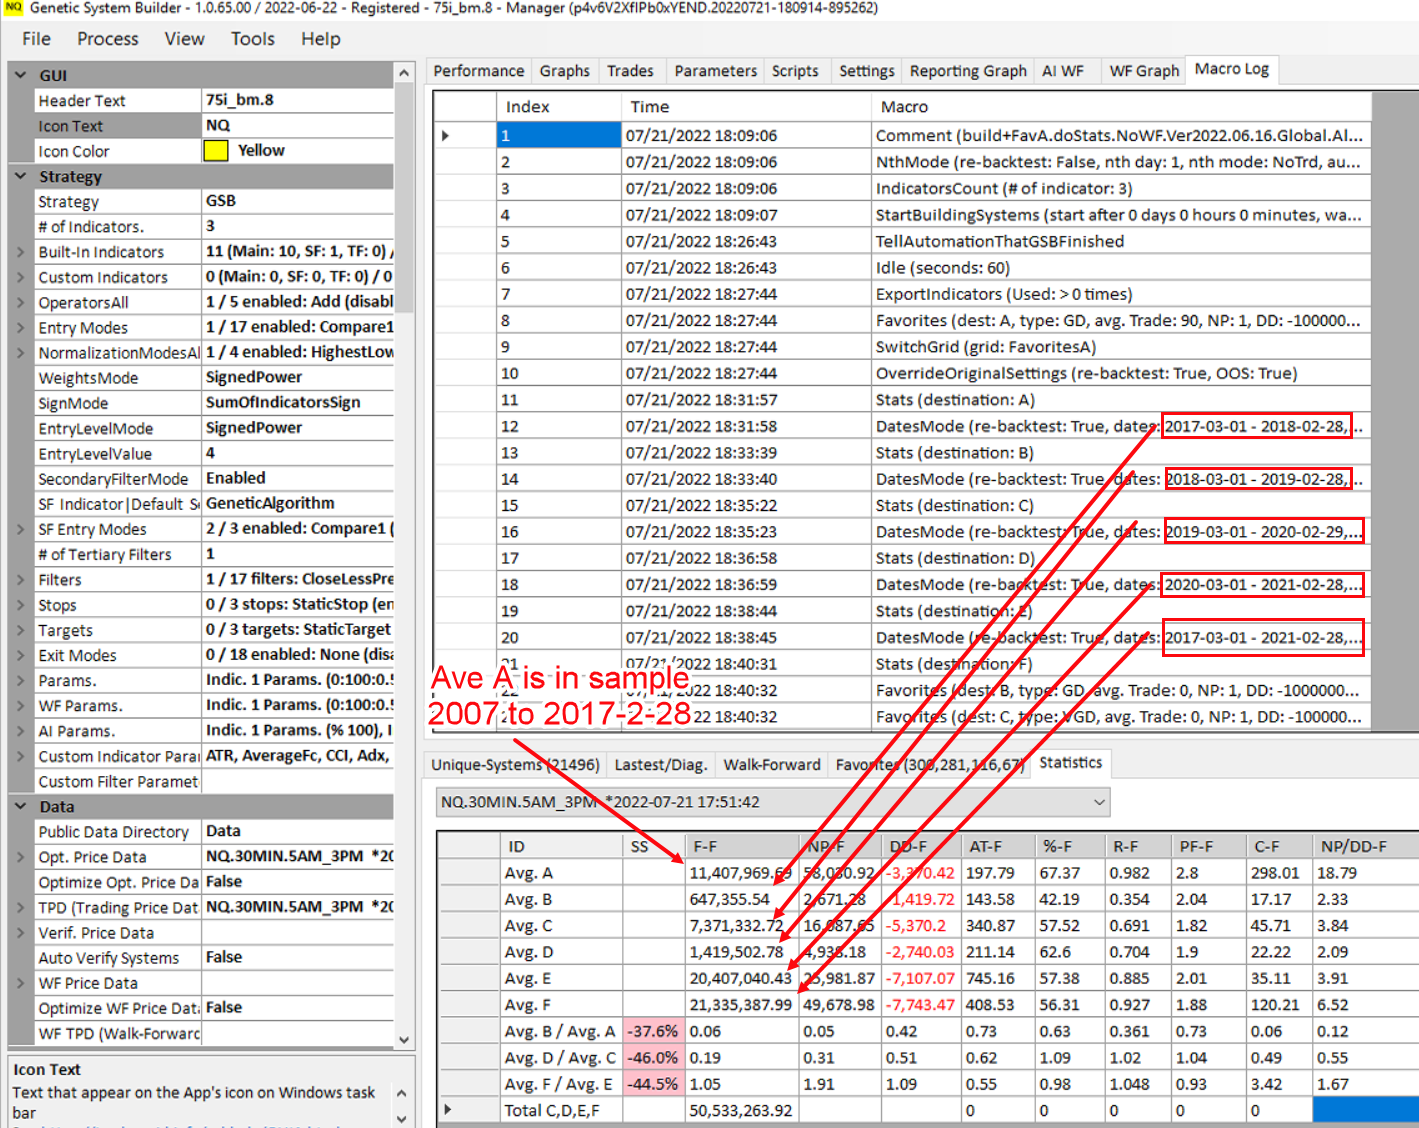
Example screen shot of statistics of the top 300 of 20,000 systems.
In summary, the entire out of sample period from 2017-03 to 2021-02-28 gave an average of $49,678 profit for the top 300 systems. If we took the 67 systems, and walk-forwarded the top members in each family in the 67 systems - we would hope that results would improve further.
The system metrics to make it from Favorites A to B to C to D get tighter as you go, so the best systems will be in Favorite D.
How to build Nasdaq futures day trading systems.
To do S&P 500 systems is likely the identical setup as the Nasdaq.
There are 6 steps.
1) Allow GSB to choose the top 10 indicators on a market by seeing what indicators worked best in the top 300 of 20,000 systems. Use these 10 indicators for step 2 below.
2) Build 20,000 systems, and allow GSB to choose the top 300, and the best of these 300 systems into Favorites B,C,D
Favorites B,C,D systems are all the systems that have good out of sample results.
All data before Feb 28 2017 is in sample, except that the indicator selection has only seen 50% of this data.
3) Put the favorite D systems in family groups.
4) Look at the family group where most of the entire group has good out of sample results. You may get none, or quite a number.
Ideally you want at least 3 members in a family group.
5) Walk forward a few members in this group. Choose systems that have got good walk forward results for live trading.
If you are using GSB Automation, run this 4 times and choose the best groups of systems from either the best or all runs.
6) See advanced options here. How to test each indicator.
7) Put the system into Tradestation / Multicharts / Ninja Trader.
Check out of sample results are good from 2021 March 01 till today's date.
If using GSB Automation, steps 1 to 3 are done automatically, and can be repeated 4 times with the settings below.
GSB Automation is available on 14 day trial for any purchased users. Its not available for trial GSB users.
1) Allow GSB to choose the top 10 indicators on a market.
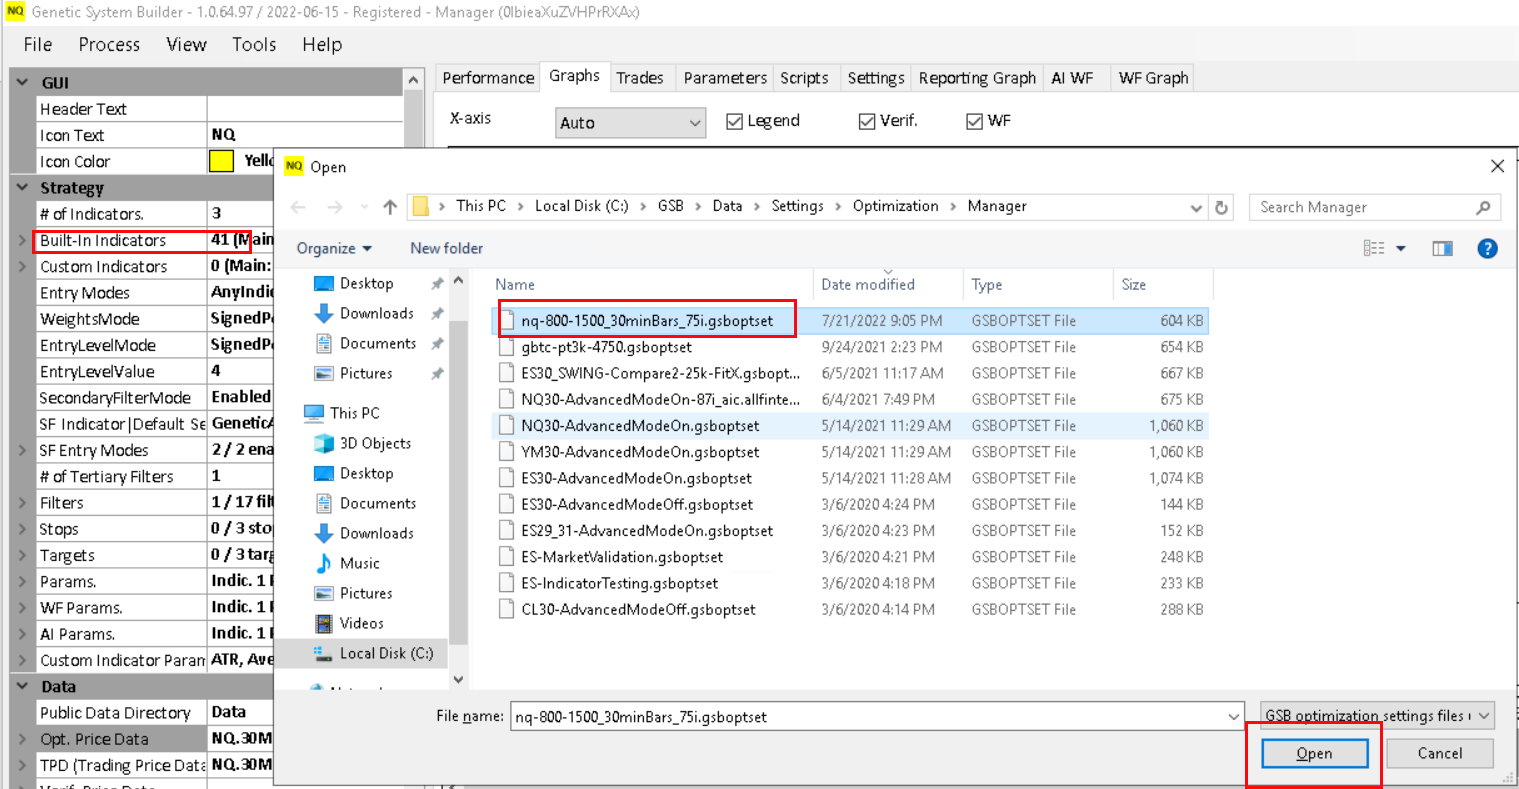
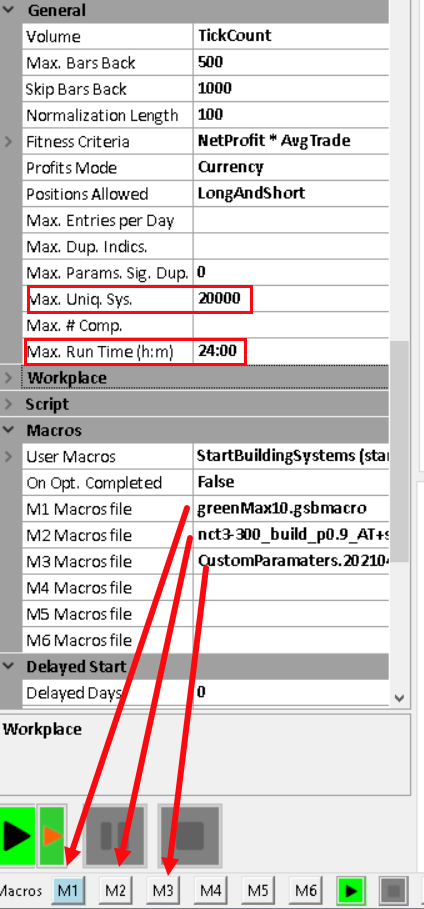
Open the GSB Manager. Next load the Nasdaq opt settings shown. This will load about 41 indicators for GSB trial users, or 75 indicator's for purchased GSB users who are in Beta mode
The 75 indicators are pre-selected to work well on the Nasdaq market out of the total of roughly 180 indicators.
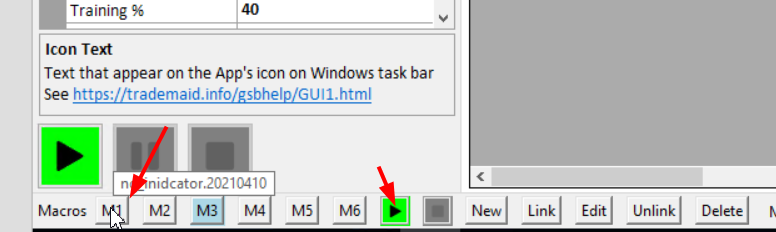
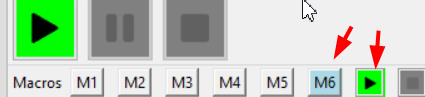
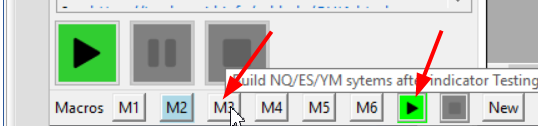
Click M1, then play. If you cant see macros, then you did not load the NQ with advanced mode on.
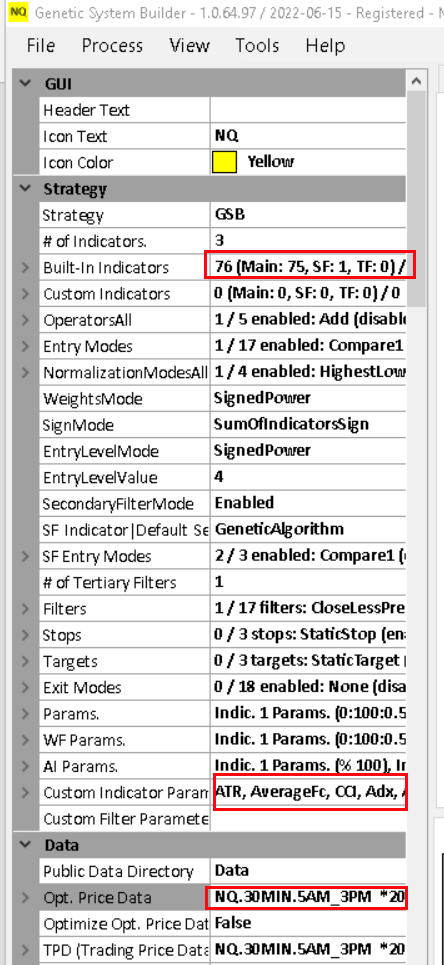
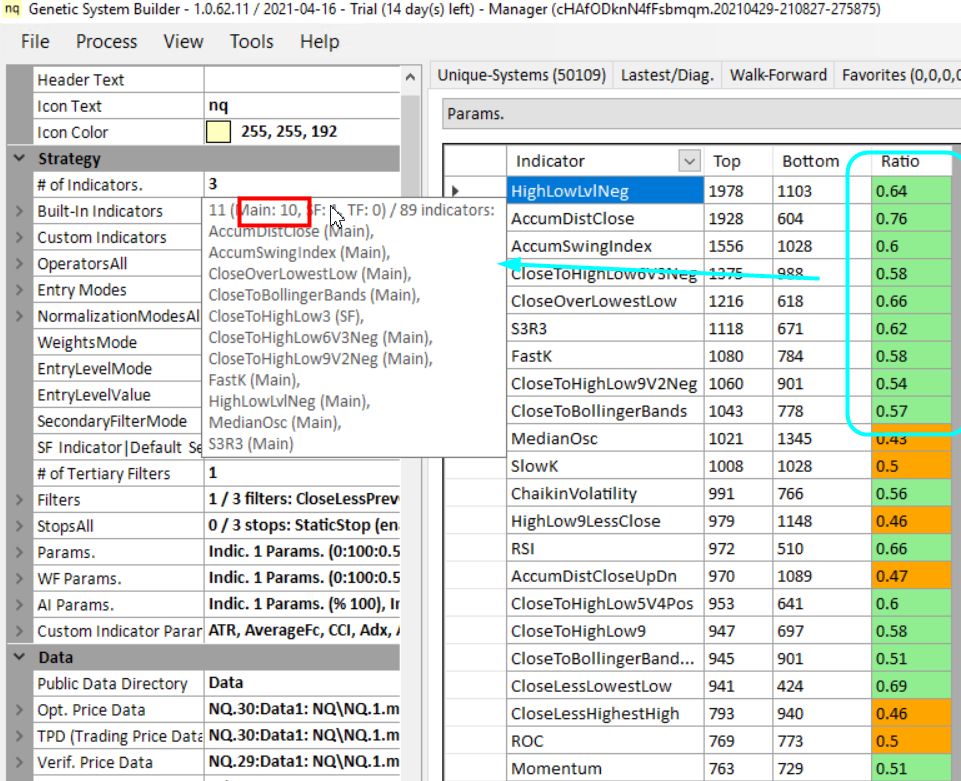
Check that you have Custom Indicator Parameter set. See above in red.
If this is the case, skip this next step below
Loading Custom Indicator parameter set.
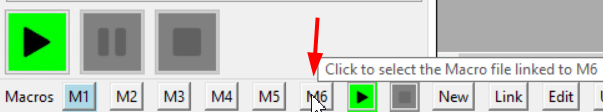
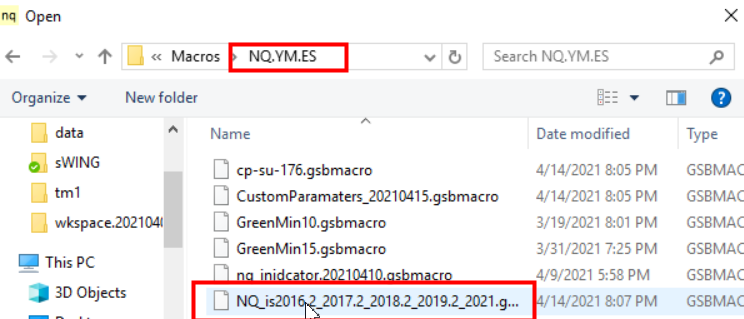
Click m6. If there is a macro loaded already on m6, then right click m6. This will clear any previously linked macros.
Click on the most recent custom macro file below
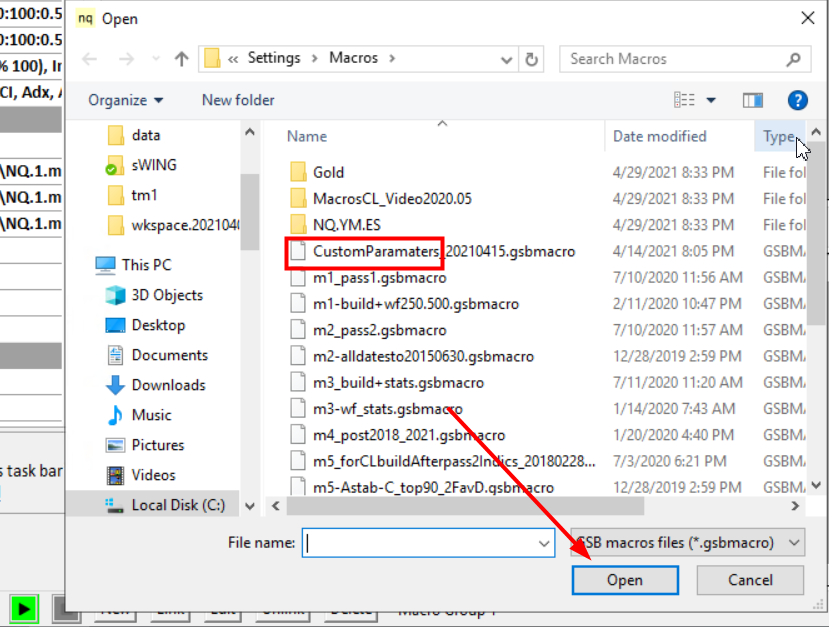
Click m6, then play. This will load the custom inidicators.
Save the optsettings so the custom parameters are remembered.
Click m1, then play.
This will build 20,000 systems, and work out the best indicators for the market you are on.
The top 10 indicators will be chosen
20,000 systems is the optimal. If you want to do a quicker test, choose a smaller number. Note also that this test will stop after 24 hours if 20,000 systems are not made.
Now you need to run as many workers as your machine allows.
GSB purchasers can just load GSB Resource manager. This takes care of the matter accord to your CPU and ram availability.
Trial users will have to start worker(s). Each worker will use extremely roughly 10 GB of ram. You also need to allow extremely roughly 3 to 6 GB of ram for the manager.
If you don't have this sort of capacity, hopefully you will get some free workers from users who contribute to the GSB cloud.
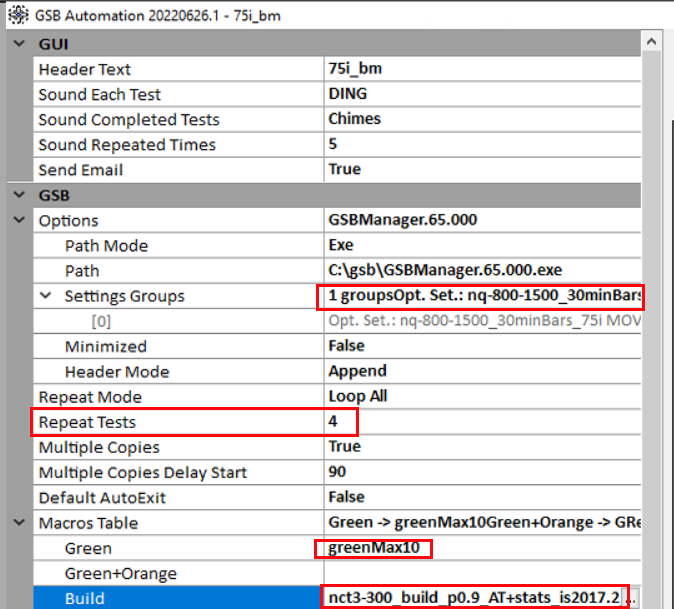
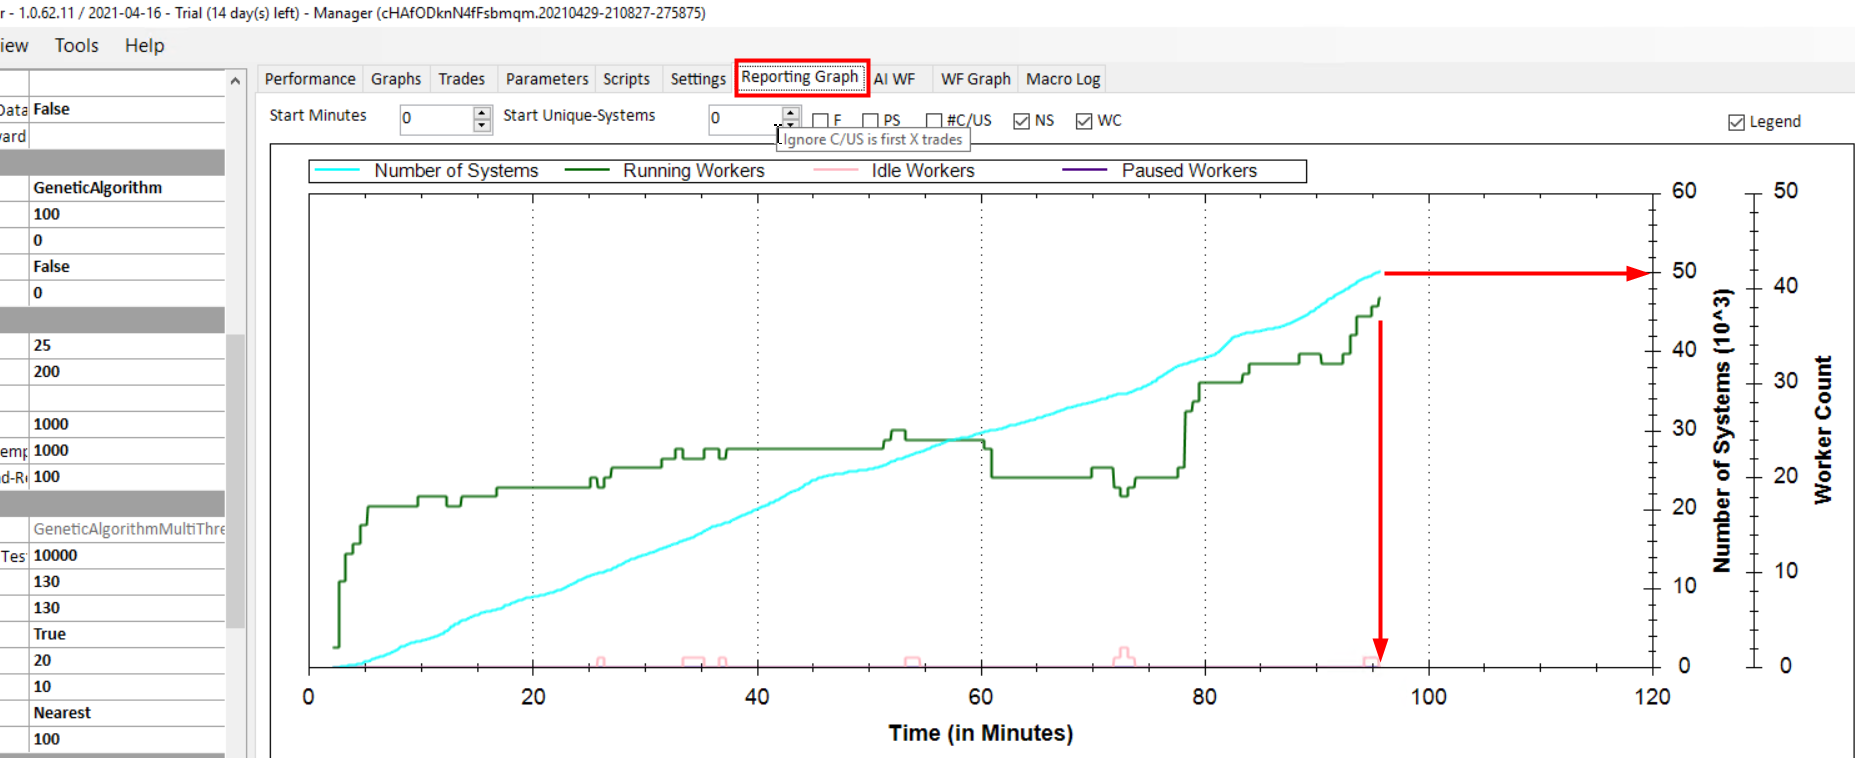
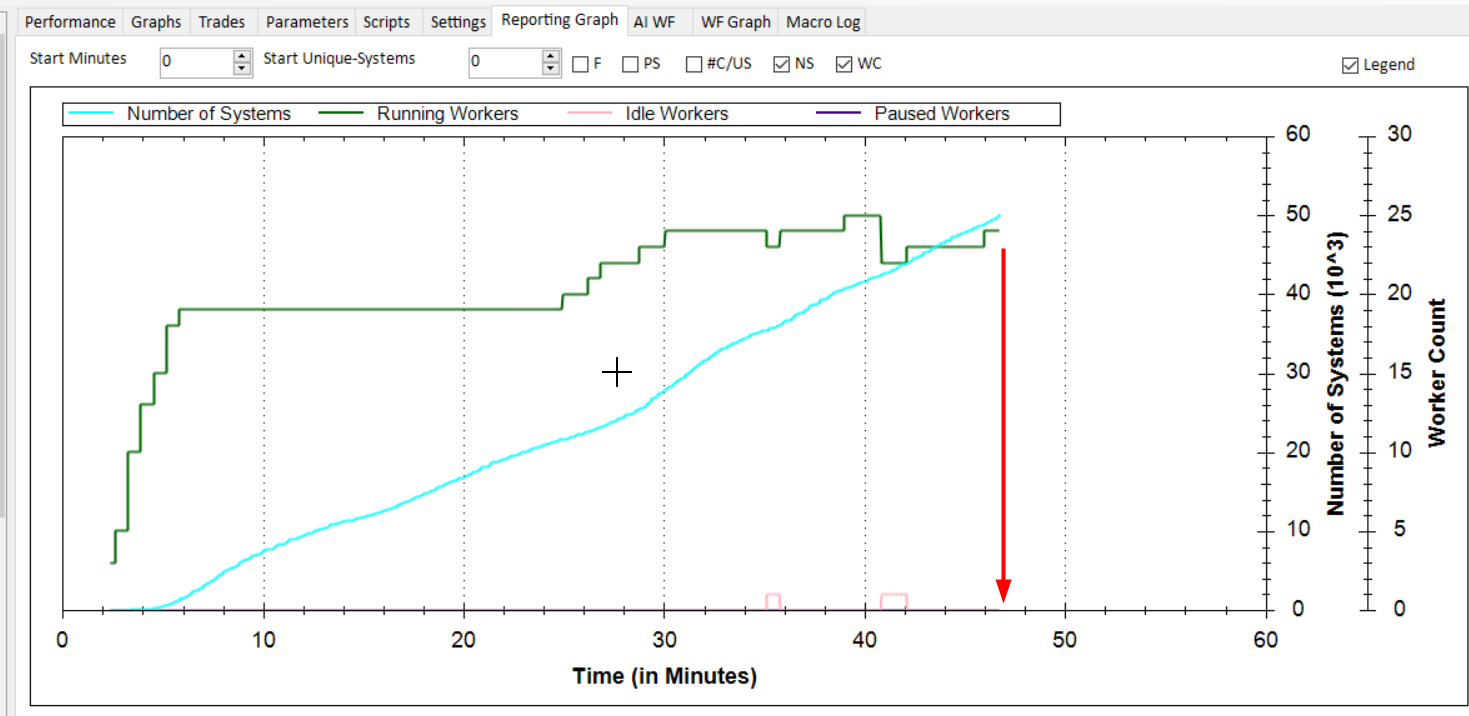
Shown here is what happens when you run M2 GreenMin10
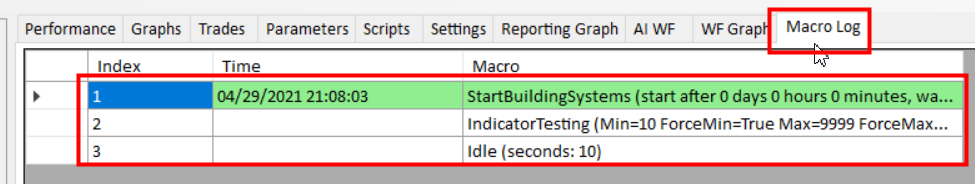
You can see below that with 20 to 40 workers, 50,000 systems took 96 minutes to build. These were all free cloud workers, but this is an unusually high number of workers that were on the free cloud. Free cloud power tends to be really good, or really poor - with little in-between. This depends if I'm personally using all my servers. You can hire a server with about 256 GB of ram for $10 a day.
The macro completes by choosing the top 10 indicators. Every time this test is run, results will vary significantly. This is a good thing as it gives more diverse output and also means GSB users will not all be building the same systems.
The macro will also have save these new settings as nq-800-1500_30minBars_75i_GReen.gsboptset. Note that _Green was appended to the existing file name by the GSB macro.
Assuming this file was saved, you can now close the manager, and re-open another manager. The new manager should open the last optsettings file that was saved.
2) Build 20,000 systems, and allow GSB to choose the top 300, and the best of these 300 systems into Favorites B,C,D
Favorites B,C,D systems are all the systems that have good out of sample results.
Note below the new manager has the 10 indicators selected, and the file opened was nq-800-1500_30minBars_75i_GReen.gsboptset
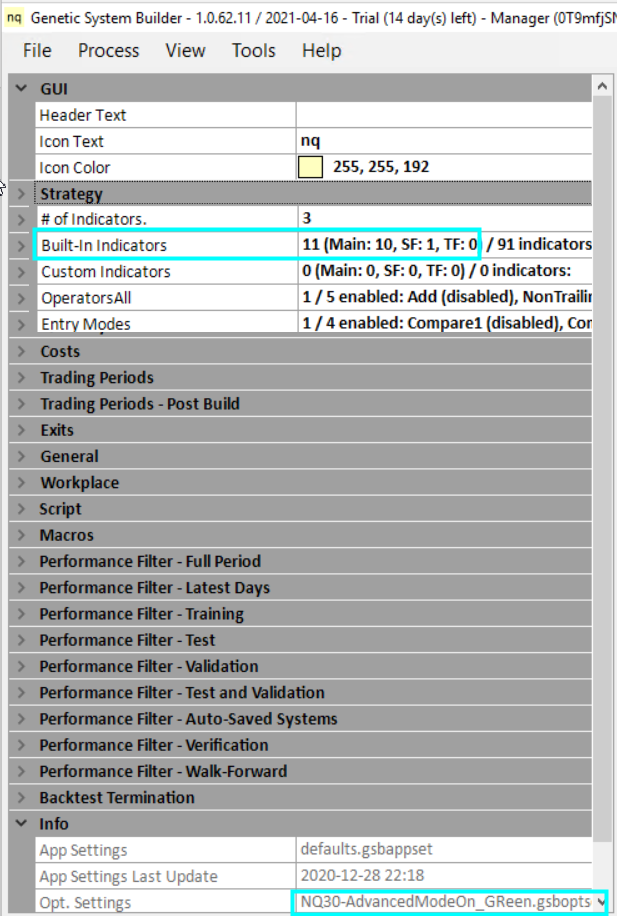
(Name in cyan is not correct. It will be nq-800-1500_30minBars_75i_GReen.gsboptset.
click M2, then play. This will build 20,000 systems.
If you don't have this file nct3-300_build_p0.9_AT+stats_is2017.2_2018.2_2019.2_2020.2_2021.2-NoStartDates.gsbmacro linked to M2, then attache M2 to this file.
Building systems is about twice as fast as building indicators.
Note the best results (average of 4 identical tests) using all the beta tester indicators, and the entry mode AnyInidcatorCrossed is below
This is the output of the VB spreadsheet that comes with GSB Automation.
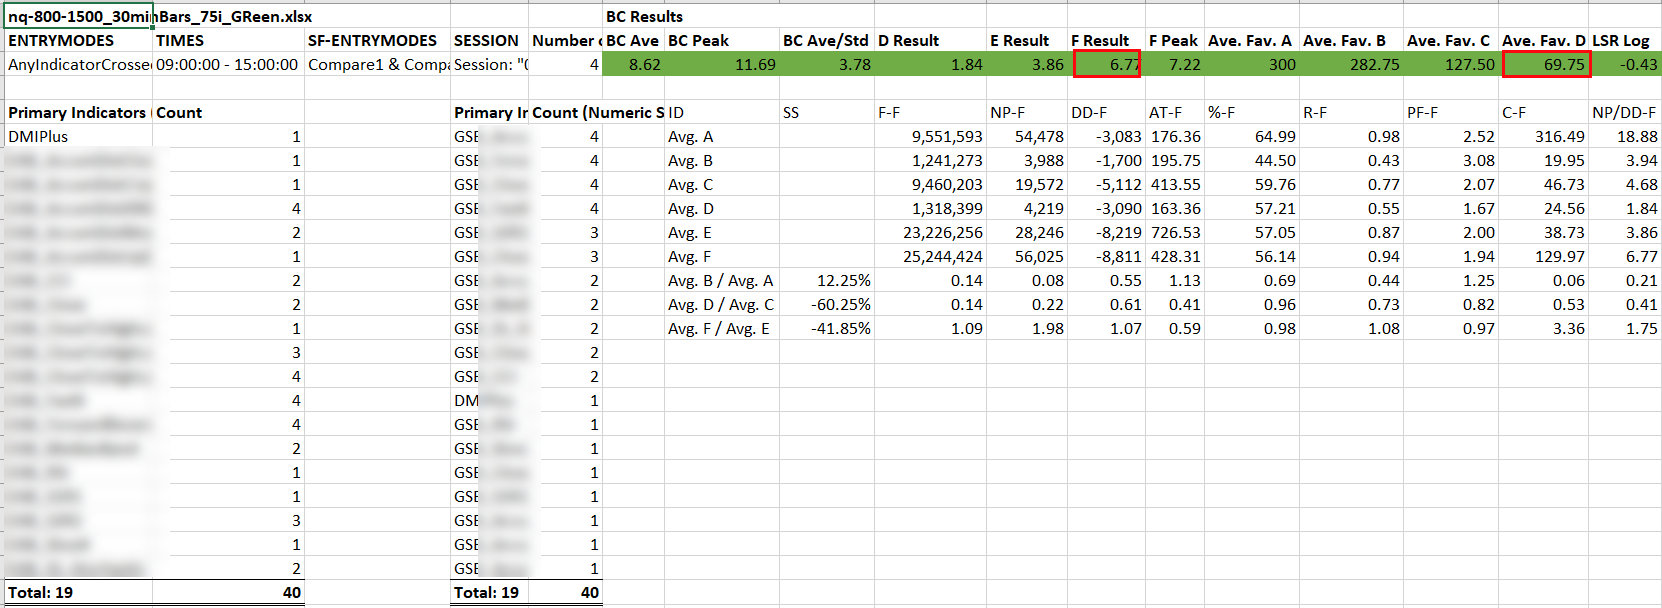
The most important metrics in the excel sheet above is the F result. 6.77. This is the result (Net profit / draw-down) of the out of sample period 2007-3-1 to 2021-02-28, and the amount of systems in favorite's D.
What systems are in favorites D?
Look at the macro 2 pictures above here.
Favorite d systems have good metrics from the first out of sample period (2017.3 to 2021.2.28)
So we now want to look further out of sample and choose families that most or all members have good out of sample results.
First select all systems in Favorite D, (Control a), dates to all. This will mean all systems are now displaying trades from 2007 to 2021. Wait for this to be completed.
Before this the dates were likely 2017 to 2021
This user task window on the far right of GSB will tell you when the dates have changed.
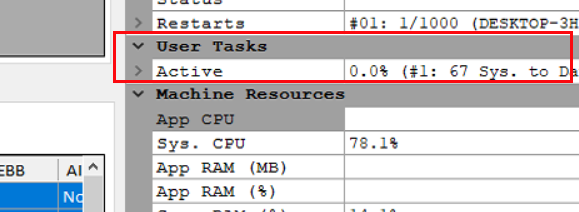
In the example above we have 67 systems in Favorites D. The bigger this number of systems the better.
We have 9 families, and the top family has 41 members. What that means is the top system has come up 41 times in favorites D, but the parameters are different.
What we want is most of the results of all 41 variations in the out of sample period 2017.3.1 to 2021.2.28 to have good out of sample results.
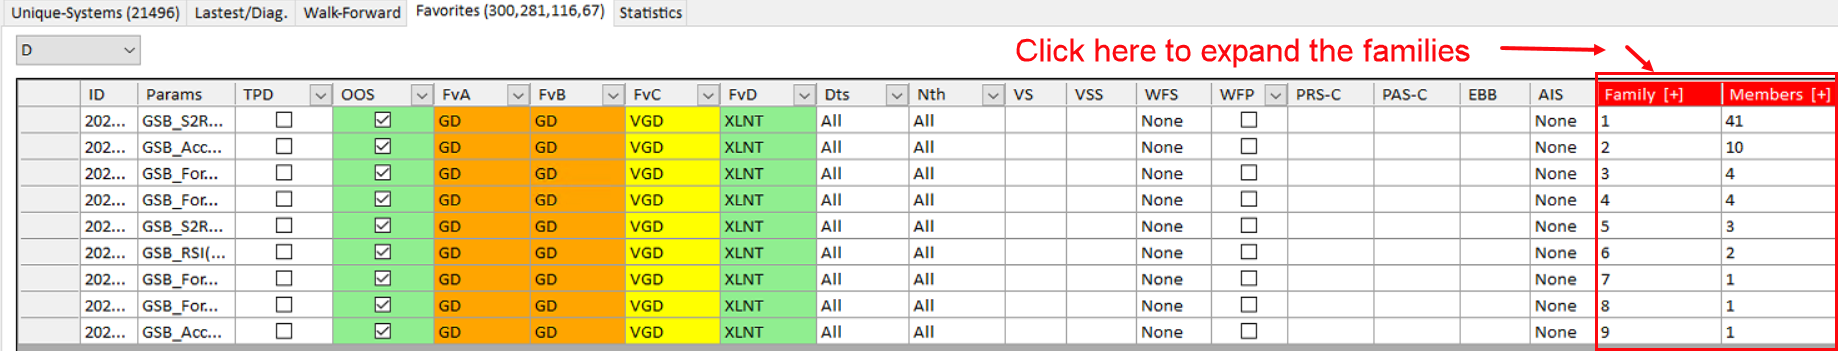
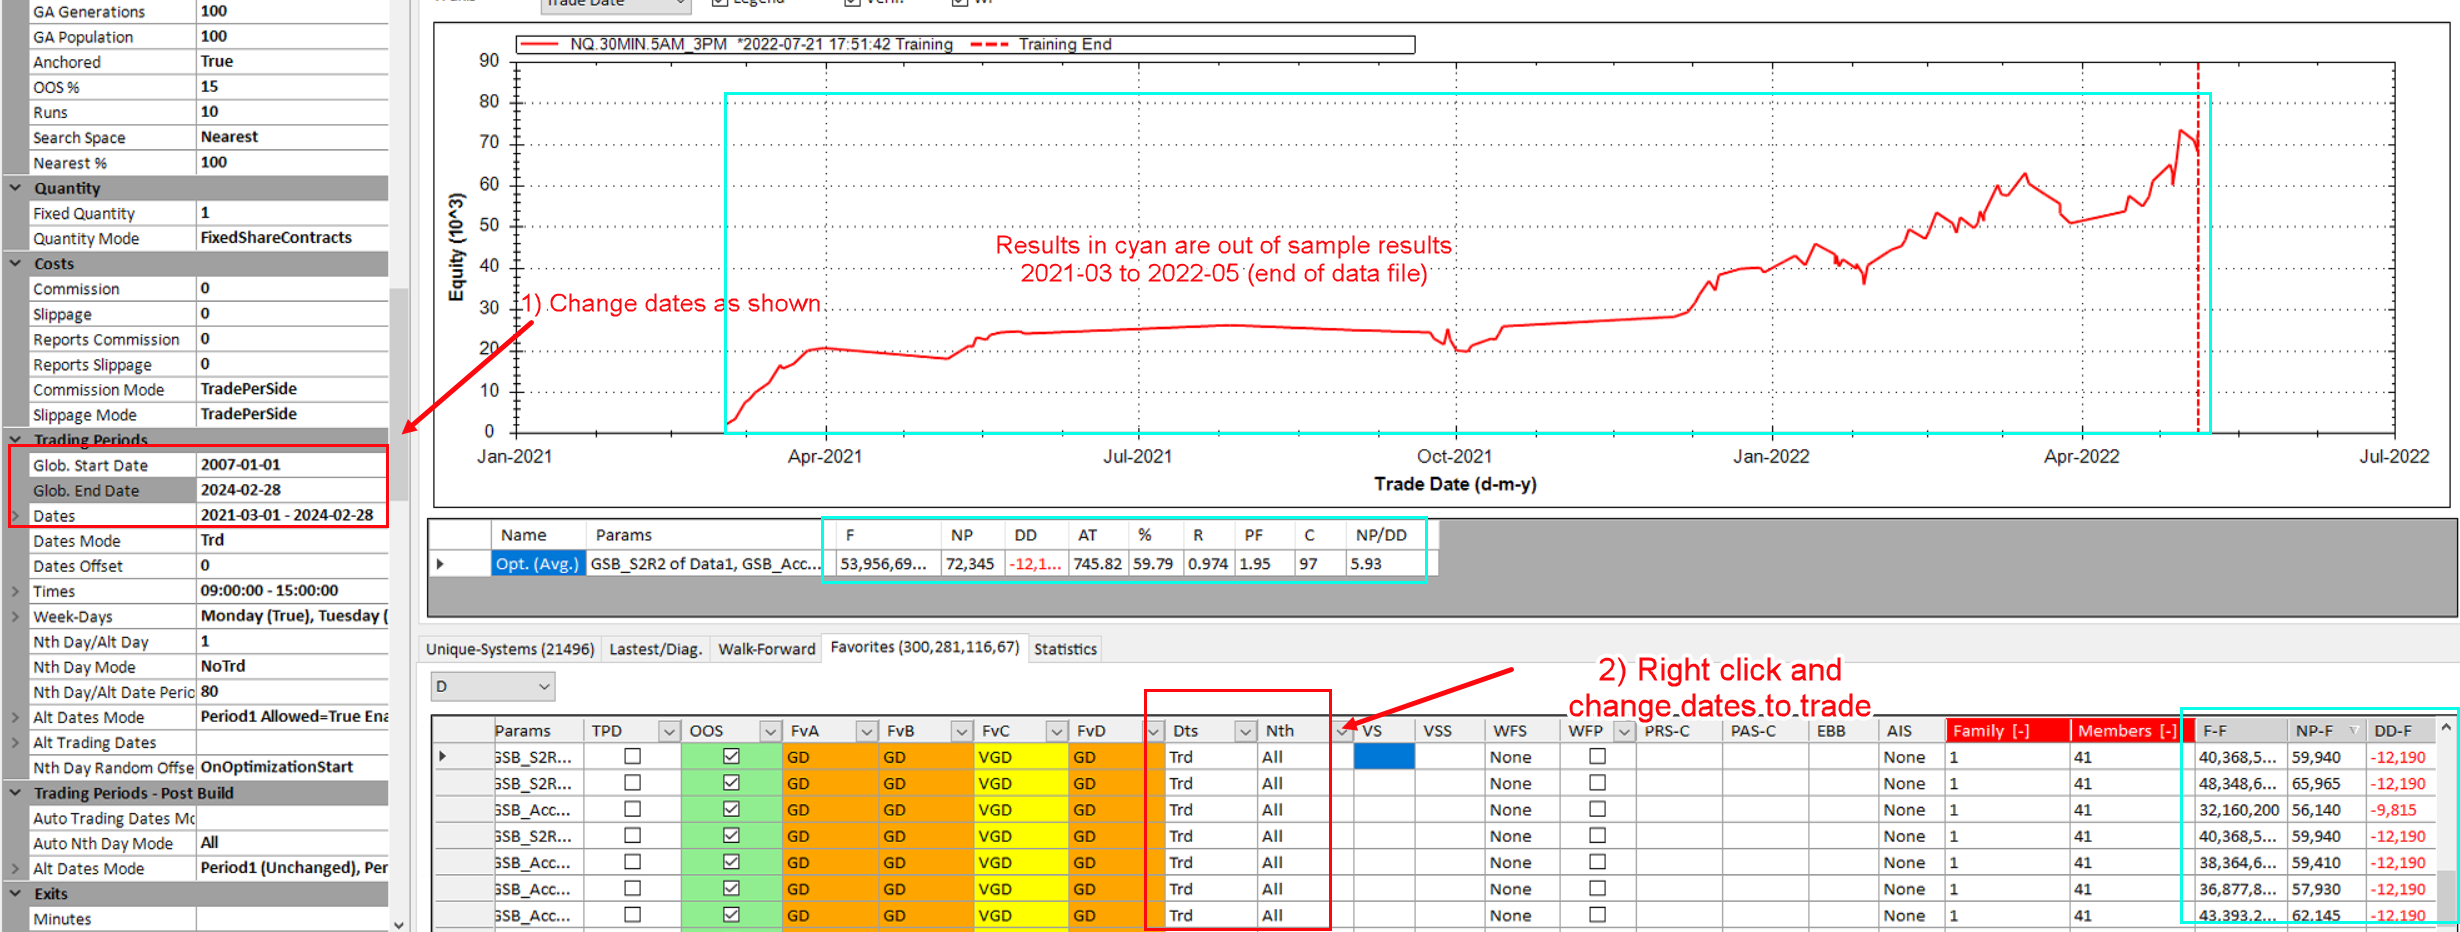
1) Click on family [+] which will expand all the families.**** See note below.
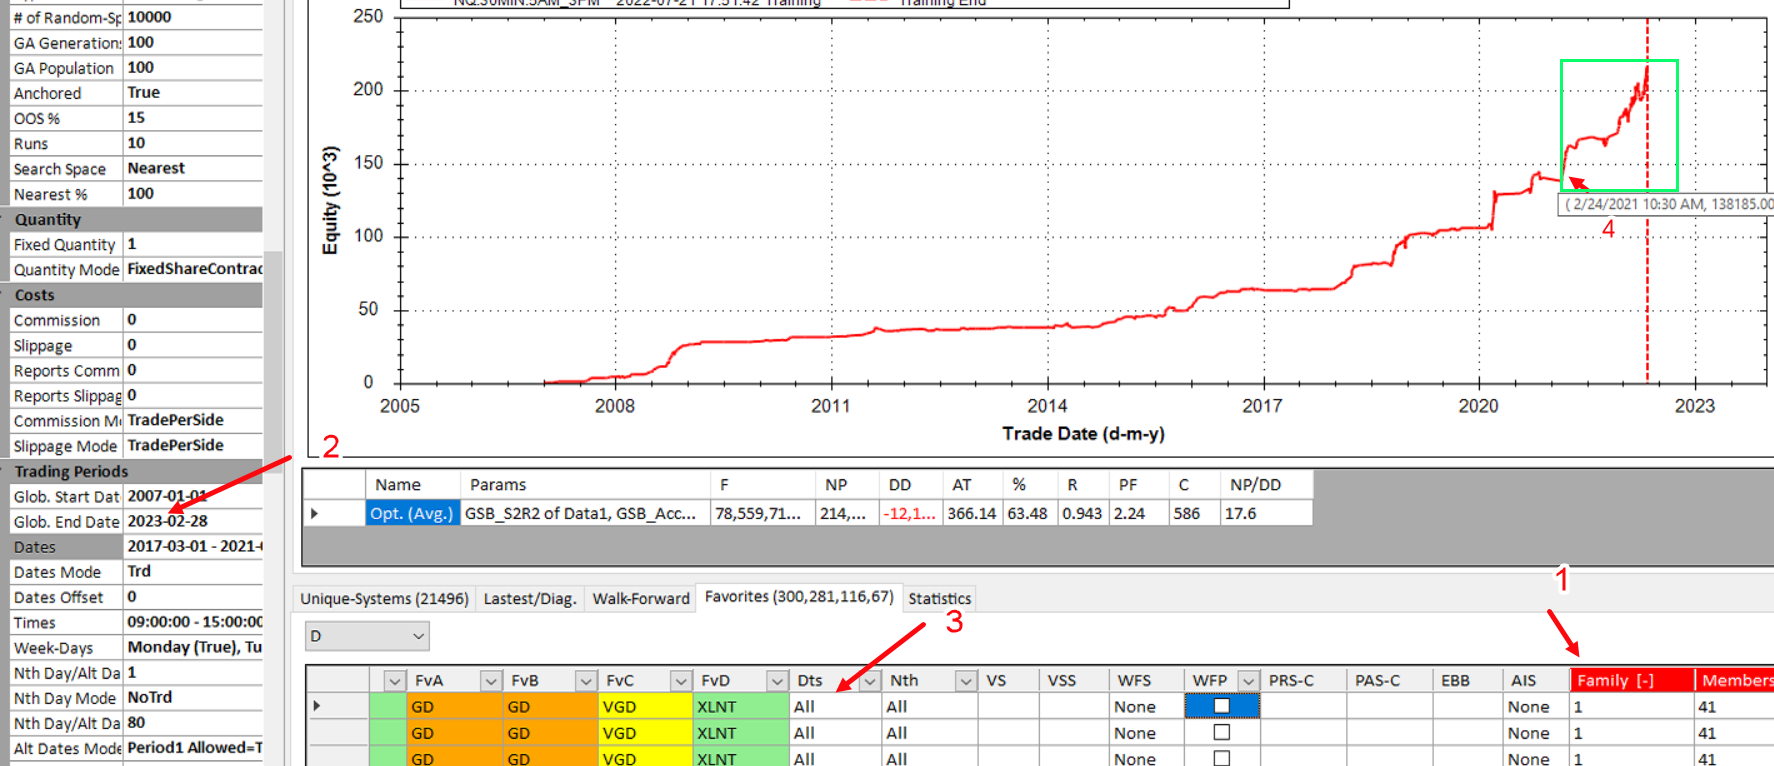
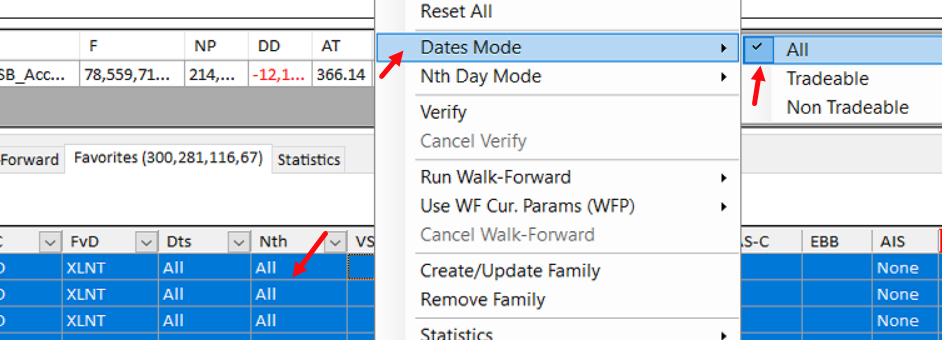
2) Now change the date by arrow 1 by adding a few years on the date. This will in effect show you system performance till the last date of the data file. (2022 May 05)
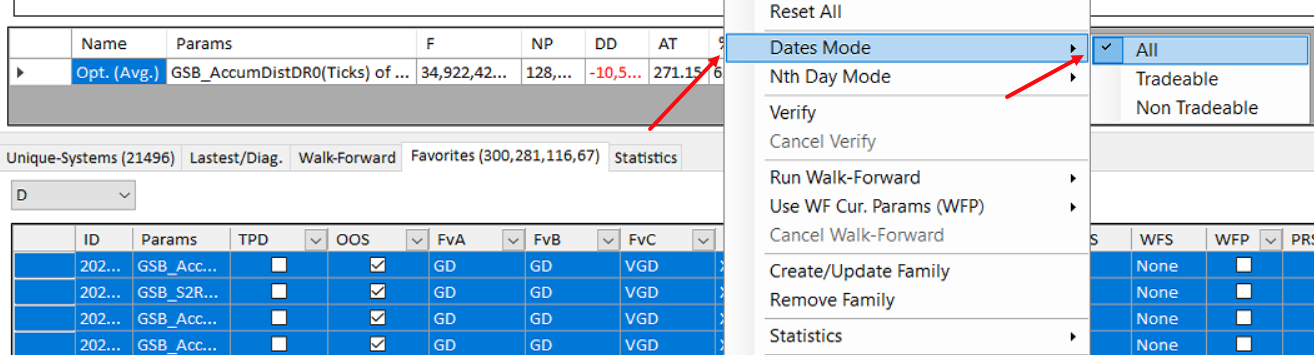
3) Select all systems. Click where the arrow on nth is, control a, control C, Dates mode, all.
4) From picture two above, check the out of sample result of unseen data has good results, the over-all equity curve is linear, with reasonable performance / draw-down metrics.
Warning on how families are used here.
There is an not obvious element of deception in how we have build systems.
Families were made using the entire data set. Families are sorted first by the one with the most members in the family, then by fitness. This therefore means we automatically choose the member with the highest fitness out of the 41 members in family 1.
Conceptually, this is not a good idea and going to lead you the user, to over estimate how good the GSB systems are as you were not away you just saw the best of 41 systems. There are two ways to avoid this issue.
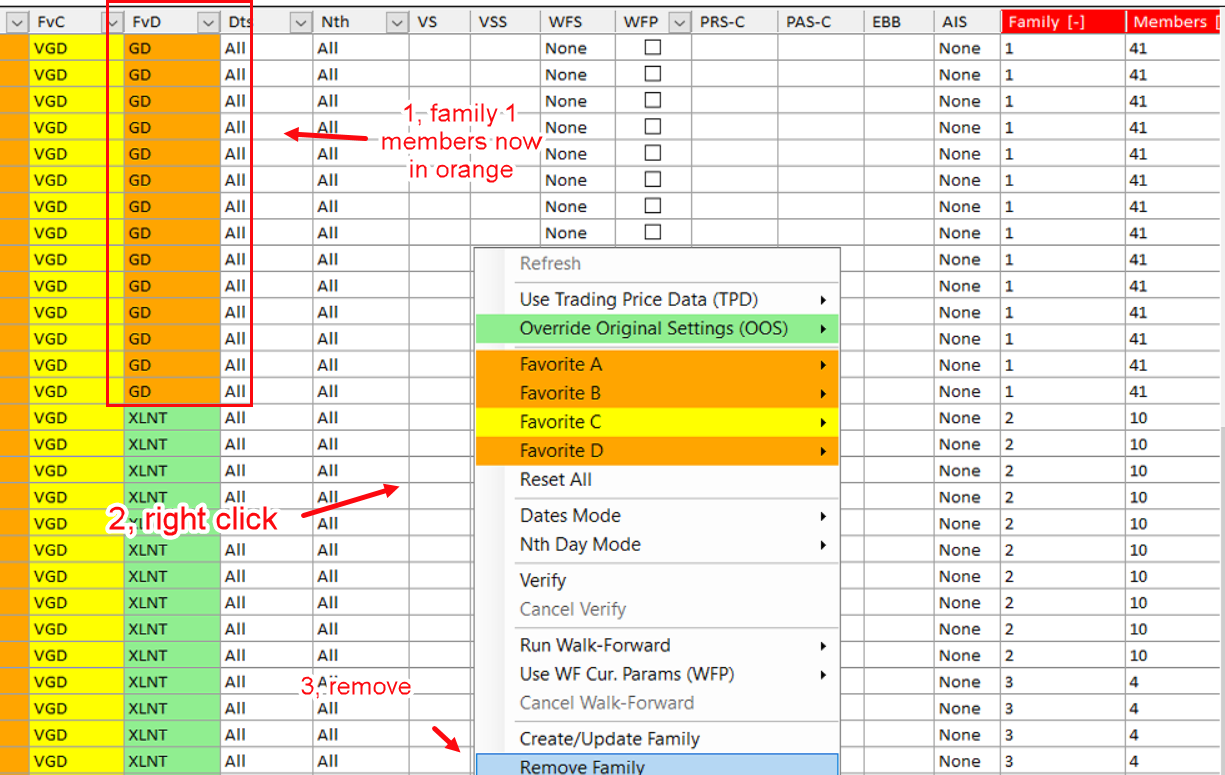
i) Do all the above steps, but either don't user families, or right click and remove families at step 1. See **** above
ii) Look at the results of all 41 systems, not just the best one. The worst system will be the last member of the 41 systems in family 1.
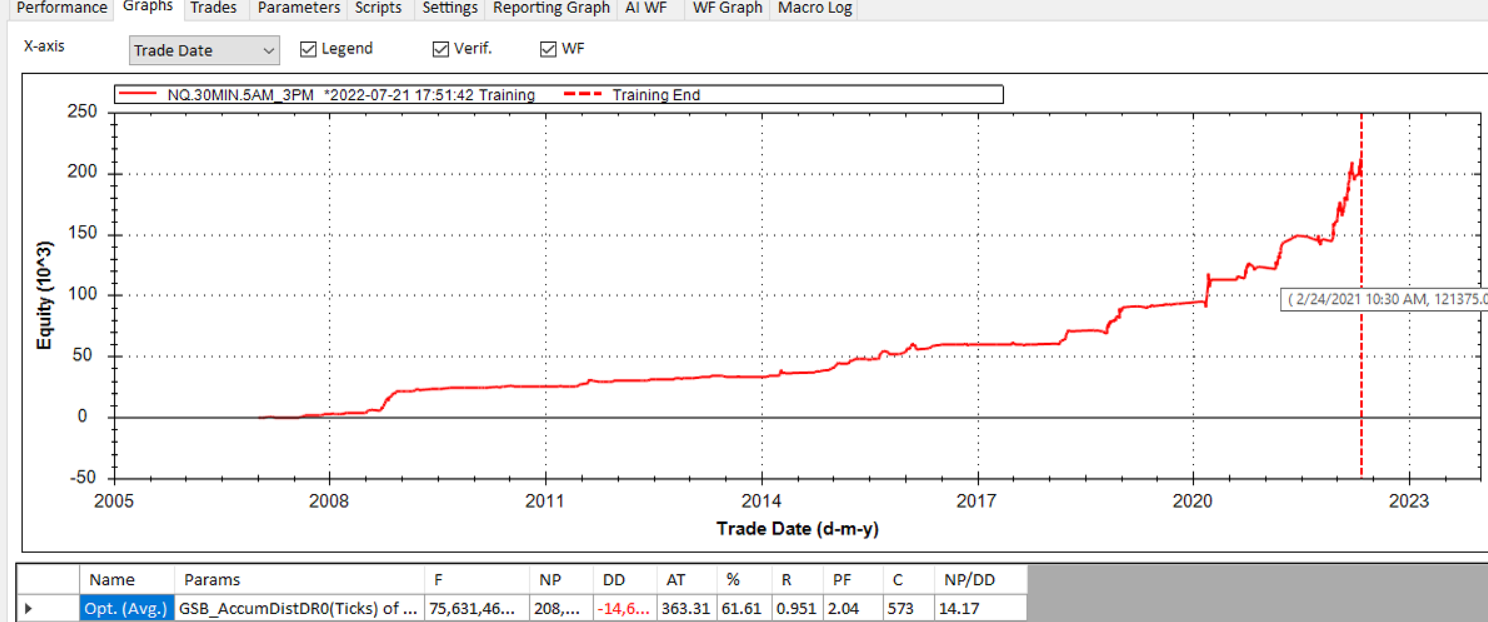
Incidentally. this was the worst of the 41 systems in family 1. It has $208k net profit, 14.6k draw-down compared to $214k net profit, $12.1k draw-down.
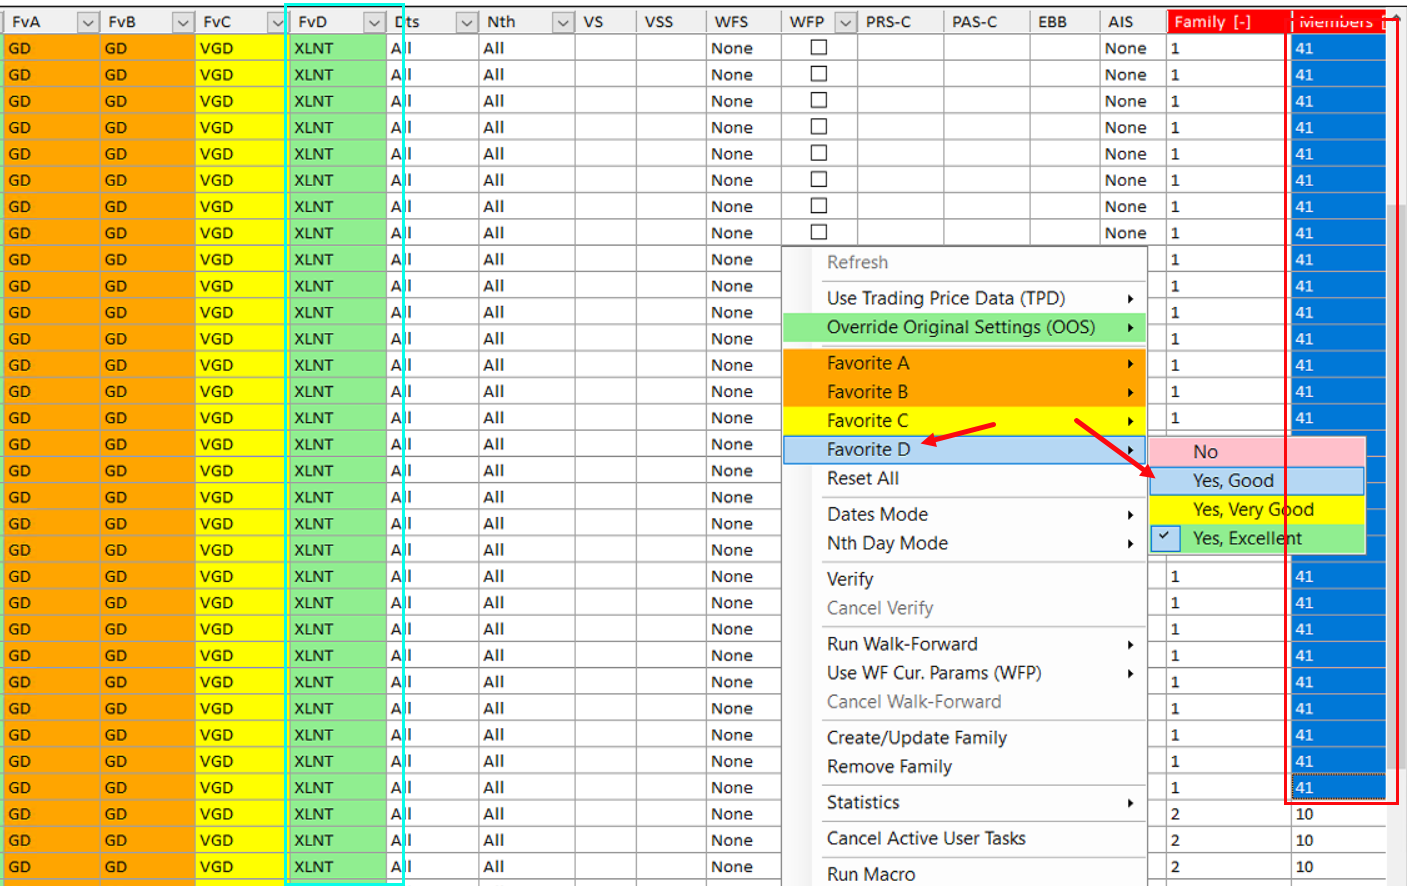
Optional tip. Tag all members of family 1, but have families removed.
Note that all members of Favorite d are marked, green - excellent. (Cyan box)
If you wanted to know what members are in family1 - but have families removed, you could select all 41 members in family1. Right click them, then click yes good.
Optional tip. So far we have focused only on family 1. This is the biggest family, but not necessarily the best family.
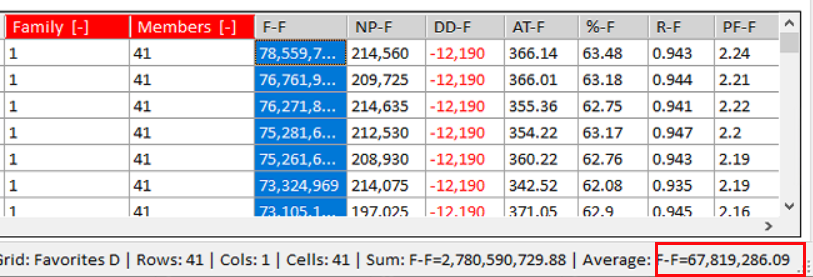
We can compare the average of all members of a family, by selecting them all, and viewing the average metrics of all systems in the GSB interface.
Here we see family1 has an average fitness of 67,819,286
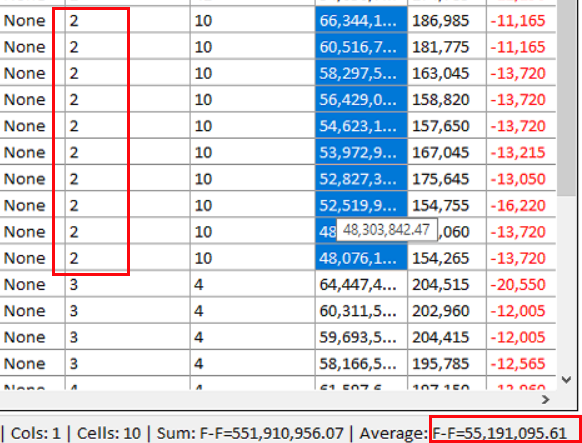
Doing the same thing on family 2, we can see the average fitness is 55,191,0905. Typically we want to use for live trading the family with the most members and highest average fitness.
We also want all the members of the family to be profitable. Should we see wide variation in results in a family, it implies the results are excessively sensitive to parameter variation. This is not good.
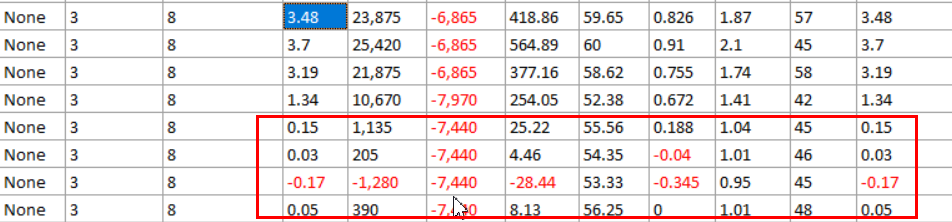
Below is an example (From a completely different setup) that shows a bad family 3. 4 of the members in family 3 had really poor performance. 1 member was also not good with net profit $10760 and draw-down $7970
Something to keep in mind is your out of sample results are massively affected by how trade-able the markets are. 2021 03 to 2022 05 were exceptionally good times for the nasdaq. If it were 2005 to 2006 results would be poor simply because trading conditions were so bad.
This is a important reality you can not easily escape. No market regime both good and bad tends to last forever.
Optional. You could also view out of sample results as shown.
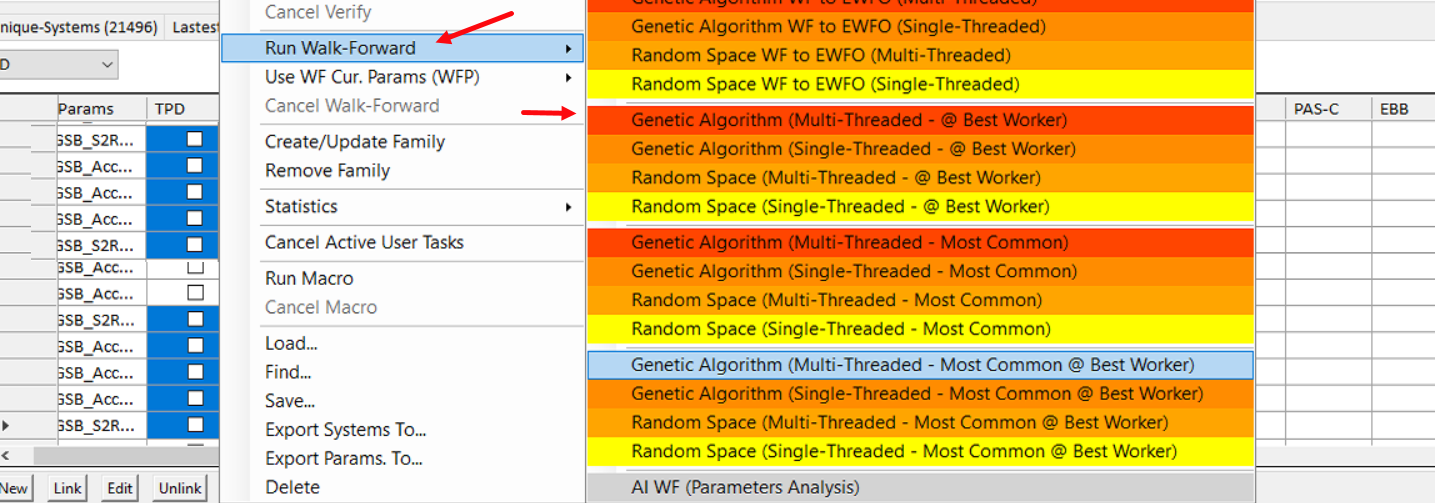
Now put dates to all, (right click) and walk forward a number of the top systems in your favourite family
Note the following.
Walk forward curves are nice an parallel. (good)
Anchored and Rolling Parameter stability is very high (good)
Performance metrics are good. (note no slippage and commission has been used yet)
Optional improvements for advanced users.
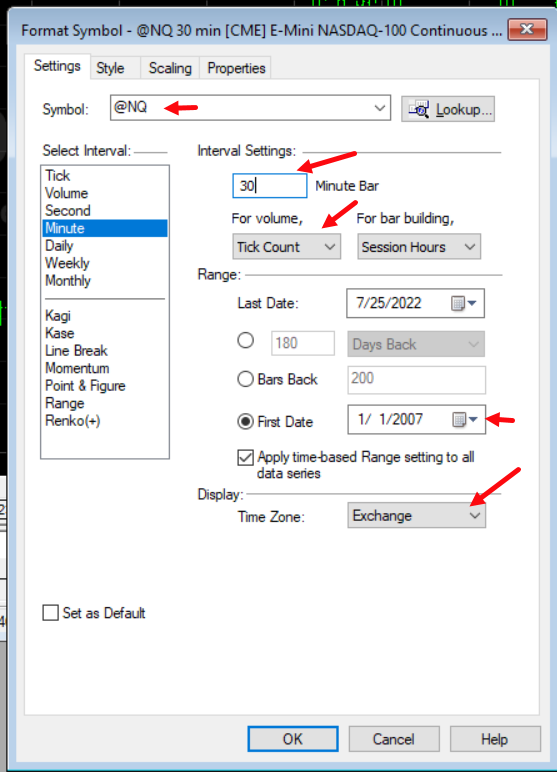
Put the system into Tradestation / Multicharts / Ninja Trader.
It is critical to use tick settings for volume. Failure to do this will lead to severe miss-match between GSB and TS/MC/NT for any indicators that use volume. IE accumdist.
Exchange time is being used because the data in GSB must match TS. If your computer is not on central USA time, then the data would not match. This is a work around for this.
Ninja trader may have issues with how volume is used compared to TS and MC. This will affect indicators like accumulation distribution. This NT volume issue is being worked on with the next major release of GSB NT.
Remember also we are using @NQ not @NQ.D because we want the data from 8am not the traditional 8:30 am