Proving the methodology
Written May 3 2019. Updated.May 6 2019
Note, there is a important update to the docs on May 6 2019. We are using "+" operand, not "*". Note also the weights used. See thick red in section 1) below.
This is a significant change in methodology. This means the weights will change only after a walk forward is done, not before.
What we are doing is building 50,000 systems with 40% of the days in sample, 60% days out of sample.
We are then testing to see what the out of sample results are like, with and without the walk forward parameters applied.
Only the top 1000 systems were walk forwarded.
This will give results similar to below.
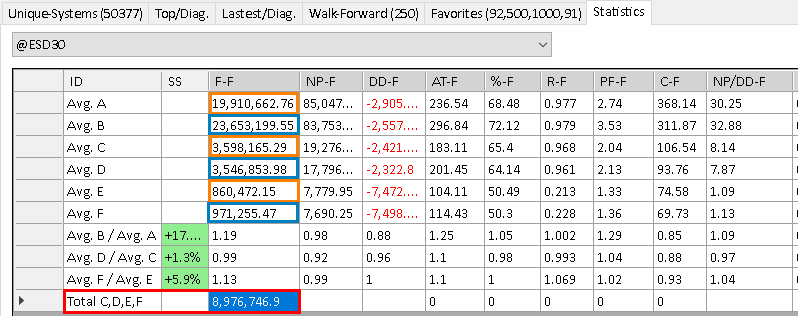
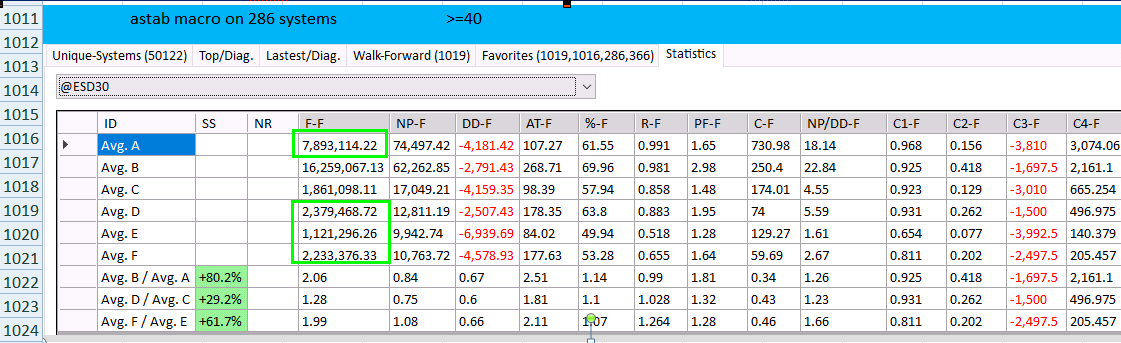
Orange boxes above are non walk forward parameters, blue box's use the walk forward parameters derived only from pre 20150630 dates.
Explanation
StatsA & StatsB (Avg A. / Avg B.)
2000 to 20150630 was built with nth no trade 1 (80 day)
All other periods are out of sample
the walk forward was done from 2000 to 20150630, nth set to all
After a WF, the results are dramatically better (stats a vs Stats B)
This is no surprise as we hope WF makes things better, and
the WF period is now 100% in sample as nth was all
StatsC&D (Avg C. / Avg D.)
This is 20150630 to 20180228
The fitness is better on all metrics, except net profit. This is mainly because the amount of trades dropped a lot. (that's fine)
Stats E& StatsF (Avg E. / Avg F.)
this is 20180228 to 20190228
Observation
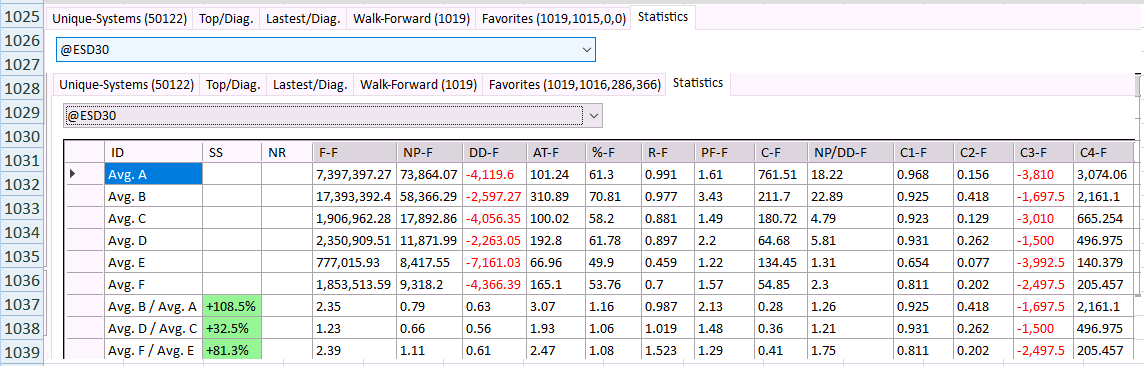
In all cased the WF parameters are better in EVERY metric in all 3 tests.
All systems, compared to top anchored (Astab) parameter set vs top rolling
parameter set.
In every case, the top rolling and and anchored parameters are better then all 1019 systems
In most cases anchored stability is better than rolling stability
Conclusion
WF clearly gives better out of sample results.
Higher parameter stability gives better anchored out of sample results.
Anchored stability is mildly better than rolling parameter stability.
In all cases, the average system performance out of sample was positive.
These are the steps that were taken.
1) Build systems
Build 50,000 systems on ES 29,30,31 with the settings shown. (S&P 500 Emini futures)
Settings below. Note. In blue, the 20 indicators used are from this test differ a bit from what is listed below.
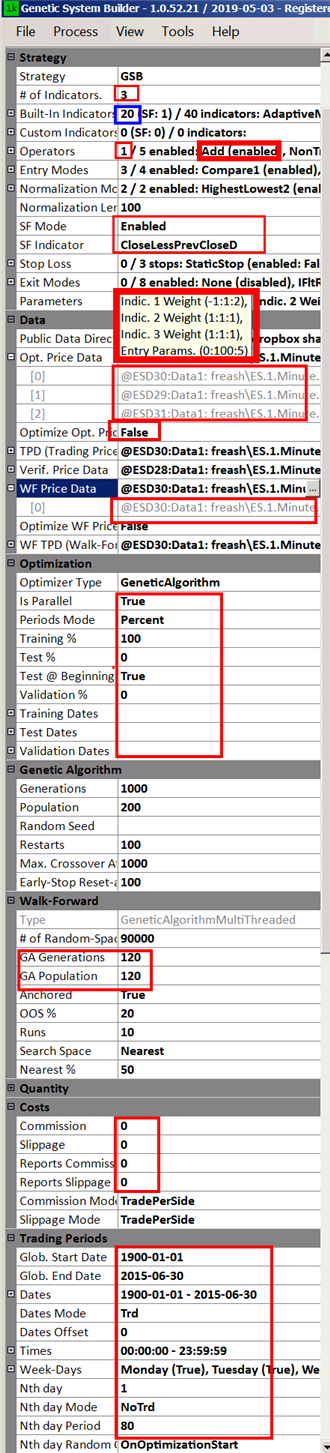
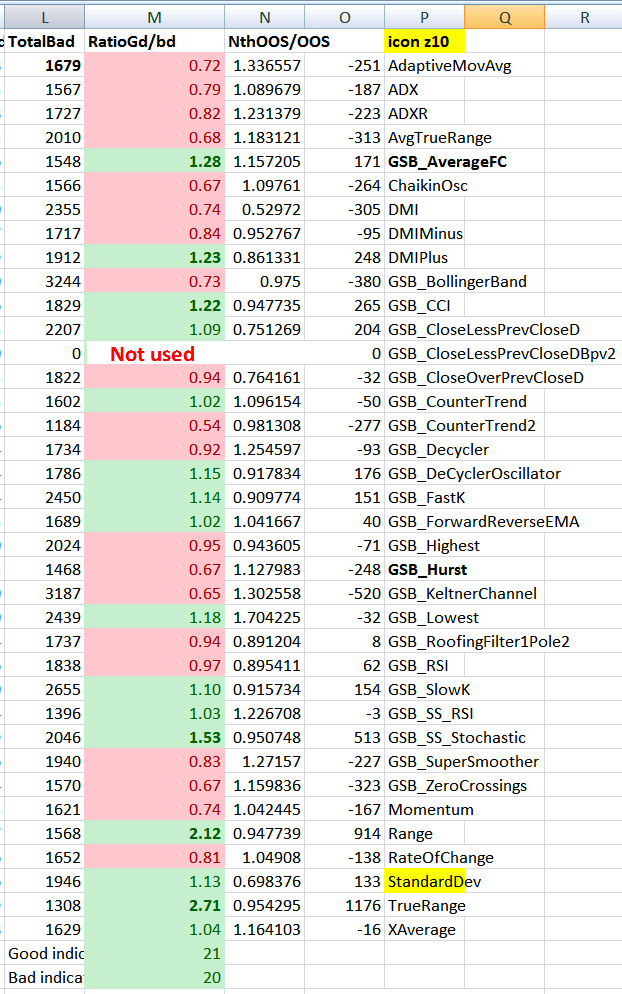
Use the indicators shown in green for S&P500. It is very important to note that the best indicators varies per market.
Do not assume these are the best indicators for all markets. The exact combination of indicators I used varied a bit from the list shown.
See this link on best indicators for more details.
2) Select the best systems
Change nth to all. Dates are still pre 20150630.
Sort on NP/DD and get the top roughly 2000 systems, put into favorites A.
This should be NP/DD of roughly 25 to 20
Go to favorite A and remove roughly the bottom 1000 systems that have the lowest Pearson's correlation. (R-F field)
3) Walk forward the systems
So we now walk forward 1000 systems. Send to the cloud.
Note the WF is done on 30 minute bars only, all days pre 20150630 with nth all.
4) Test non WF settings compared to WF settings on 3 data periods
This step is all done by running a macro.
There are three data periods.
i) Pre 20150630 (In sample)
ii) 20150640 to 20180228 (out of sample 1)
iii) 20180229 to 20190301 (out of sample 1)
Note we have two out of sample periods. The periods are quite different in character, and the best indicators were not derived by using 201802 onwards data.
This is to avoid any 'leak' of out of sample to in sample
Likely, before long the macro's will be included with GSB.
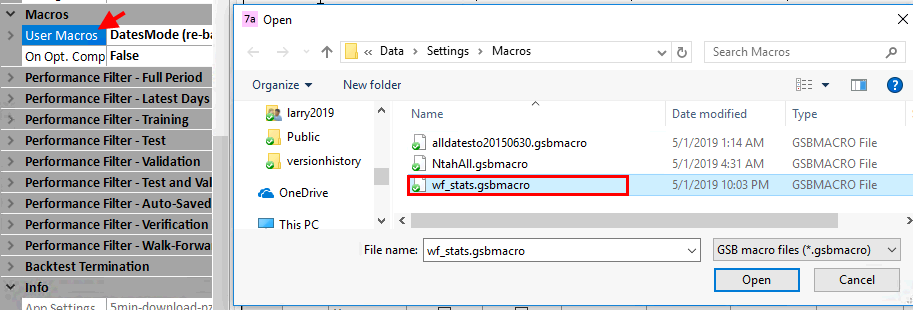
Load the macros below and Unzip them and put them in (or whatever location you have GSB manager in)
C:\gsb\Data\Settings\Macros\
Download from here. https://trademaid.info/forum/files.php?pid=3716&aid=2270
So you load the macro.
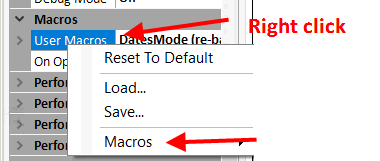
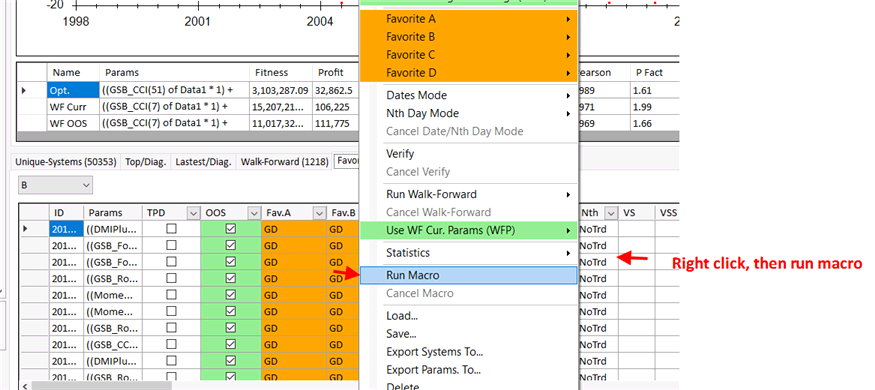
Run the macro. See below.
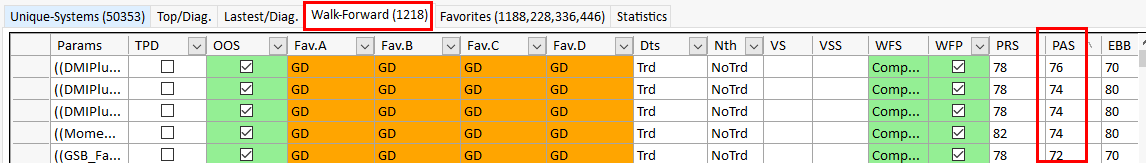
5) Repeat step 4 on only the systems with Anchored stability >= 40
Below, add all systems with Astab (PAS coulomb) into favourites B.
Run the Macro again from favorites B.
Below, most metrics improved with Astab >=40 compare to all the systems.
Below are all the systems that were walk forwarded. Note overall, the metrics are not as good as the one above with Astab >=40.
So we chose systems that also have Astab >= 40.
6) Analyze the results
WF should improve results. Astab should improve results.