Legacy proving the methadolgy
Updated June 12 2019. This guide will be improved greatly over time.
You will need GSB 52.79 or later to perform all steps below. If you do not have this version please contact support.
The following steps should be performed. Users may make their own variations of this. The foundation is step 3 below.
This methodology likely will be improved over time. Uses are very welcome to validate the methodology with their own testing.
Most recent tweaks are here. Note they gave a 50% increase in out of sample results from the methodology of a month ago.
1) Chose the correct secondary filter.
This is critical to get right.
Stock indices, closedBPV
Most other markets
GA Closed/closed and or GA Close-Closed
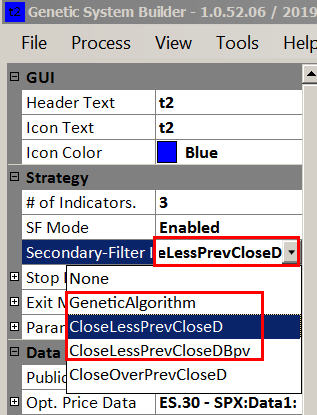
GSB 2.0 Is going to have this coded per market as a default, but with the option to over ride this.
2) Choose the correct session time & dates.
This is not needed if GSB documentation shows a session time.
All times quoted in exchange time, but set your chart to local time.
Basically we choose the hours where the volume and volatility is.
In nearly all cases, 30 minutes is the best time frame.
You normally use the start date of where the contract is liquid.
S&P 500. Normally 1/2000 but 1997 also is OK. 830 to 1500 (not 1515)
Energies 9/2006. Session time 900 to 1430. Use CL,HO,RB,NG for data2. (IE CL data1, HO, RB, NG, data2 - NG data1, CL, HO, RB, data2)
Soybeans 2007. @SM, @bo data2. Needs to be rechecked but likely session time 800 to 1300
Silver & gold 12/2006 For silver use gold as data2. Session time 730 to 1330 for silver. exchange time. (Gold I have not tested session time and data2)
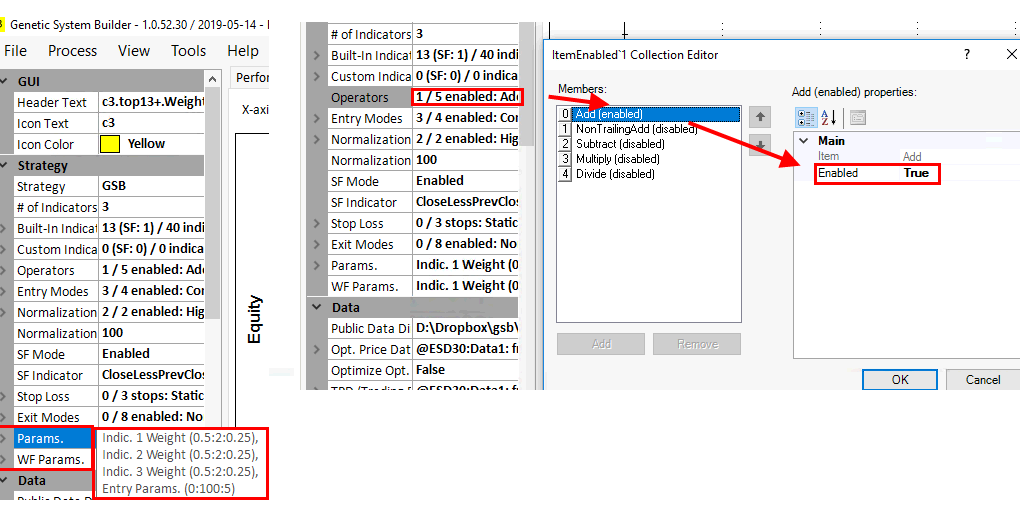
3) Chosen the correct settings.
There are a number of changes in June 12 2019.
Use only the multiply operand with weight mode signP.
Use weights 0.5 to 2 step 0.25 for all weights. Do NOT use subtract or negative weights.
Parameters AND WF parameters are as follows.
It is very deliberate that we do not have a low weight for any indicator. The reason is if we do indicator1*0.001+indicator2*1, the value of indicator 1 will have no effect at all. This has then added redundant logic into the trading system. (not good)
4) Do market validation.
Market validation is testing 1000's of systems to test what the 1000's of systems do collectively. This gives us a much better idea
of what works best, than just building a few systems. This process is now fairly quick, and the work flow now automated by macros.
Once we have a benchmark for a market, we can tweak one thing at a time to note if it improves or degrades performance.
See this video for more details. Market Validation 3. Macros and how to automate market validation and find the best and worst indicators.
New users often get in trouble by changing things that will cause the average system on GSB to degrade greatly compared to defaults.
Examples of this is moving to far away from 30 minute bars, not using the correct data2 streams, session times or using the incorrect secondary filters.
Here is an example of data streams to be used. All 30 minutes.
S&P 500 futures. None needed.
Crude Oil futures. Heating oil, natural gas, unleaded gas.
Soybeans. Soybean Oil and Soybean Meal
Silver. Gold
S&P 500,NASDAQ, Dow,Russell 2000, S&P Mid-cap 400 futures. 830:1500
Crude Oil futures. 930:1430
Soybeans. 830:1315 or 800 to 1300. (please check volatility and volume)
Silver. 730:1330
Euro FX @EC Session times were 2am _ 1400 MOC true. trading session 7.30am _ 1300
EC.30min data1 and EC.120min data2, 2am - 1400. The EC results were from user Bruce.
I am not sure if market validation was done on the EC figures.
5) Find the best indicators
or this video below to choose the best indicators. This step alone DOUBLES out of sample fitness / performance in my testing on S&P500.
So this step used to be optional, but is now considered essential. If you want to give GSB a high speed test and make a system not for live trading you can skip this test.
It is likely in the future release of GSB 2, that the best indicators are soft coded to each market. Note also the best indicators are different for each market.
6) Build your systems with significant out of sample periods.
Shown in the graph below, 60% of the days are out of sample.
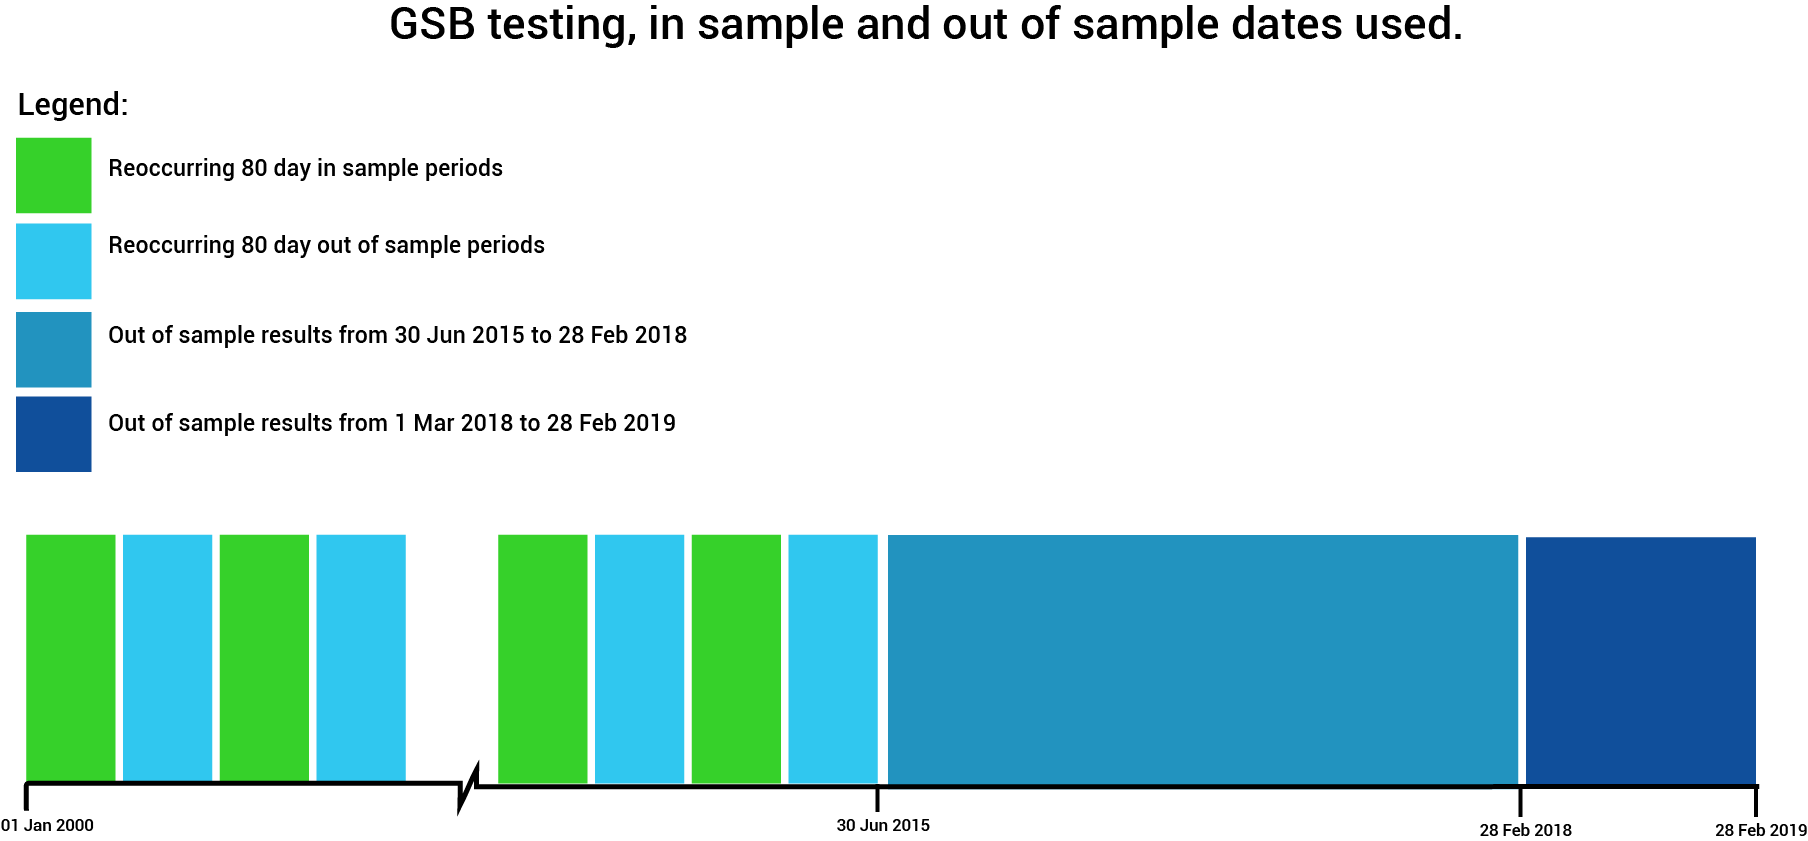
I like to build 50,000 but that may take some users too long. Doing much less is fine - especially as a quick test.
It is better to do this on 29,30,31 minute bars. Note for some markets this may be excessively CPU intensive. If you are doing just a quick test on GSB, use just 30 minute bars.
If you are low on CPU power, you could build on 30 minute, choose the top systems, then verify just the top chosen systems. This variation however has not been validated to see if its as effective as building on 29,30,31 minute bars. Putting your systems into favourites is going to be helpful.
Verification can be done on the cloud,rather then your manager or standalone GSB
Remember if you use the manager, you will get free GSB cloud workers to make things faster.
Change nth to all, and dates to all. You may want to leave 1 year out of sample through the entire test.
If this is done, its VIP to factor in what the market conditions were in the last year. If a market was UN-trade-able, don't expect good results in the last year.
If the market trended well and was easy to trade, you may get a over optimistic picture.
As a guide you could use these systems.
https://kjtradingsystems.com/StudentStrategies.pdf
They will be very distant cousins to GSB systems. The reason is most are on daily bars, and have massive stops.
Kevin Davies has a good reputation, and I am told that this is a fair sample. Both 'success' and 'failures' are shown.
I suspect the Crude Oil system may be well above whats typical in this period, but I haven't checked my own crude oil systems for a long time.
7) Chose some systems with great metrics.
You now have systems with significant out of sample ratio to in sample.
Change dates to all, nth to all. Pick systems with high pearsons, pearsons by date and good netprofit / drawdown ratio.
Add these systems into favorites A.
Then remove systems in favorites A that do not have reasonable metrics. For example you may have added a systems with good netprofit / drawdown ratio, but poor pearsons ratio.
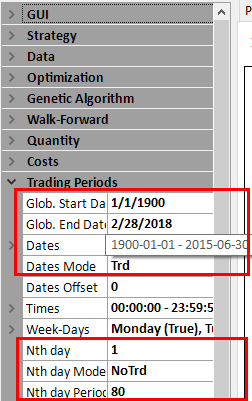
8) Walk forward the systems to get systems with high anchored stability scores
Using only data (Global dates) pre 2/28/2018 or 6/30/2015, but change nth from no trade to ALL.
If you want to confirm how well this methodology works, then use 6/30/2015 as it gives you roughly 3 years out of sample.
If you are happy with the methodology - and want to build a system for live trading, then WF all data before 2/28/2018
Sent the systems to the cloud, not your local GSB manager.
I normally use anchored WF, and choose systems with high anchored stability score. The higher the better. However high rolling stability score is also good - but not as good as anchored. Systems with anchored stability >= 40 were very significantly better than the average of all systems. Higher anchored stability scores are hard to obtain than rolling stability scores. Astab 40 roughly = Rstab 62.
You may also look for good anchored and rolling stability score. Do not mix up the term anchored stability test, with anchored parameter stability. They are two different things.
To clarify what is meant here, the systems with high stability performed better with and with out the WF parameters compared to low stability systems.
An important note, post 6/30/2015 out of sample results improved greatly after the WF, but we did a WF with nth set to all, not no trade. This means we have chosen systems that gave good results with a fairly small in sample to out of sample ratio. This confirms (though is not full proof) that they are valid systems. Then we have WF the systems, but now have a greater In sample ratio as we are no longer skipping every second group of 80 days. This gives us a more accurate view of the parameter settings that work much better post 6/30/2015.
Use WF on a single time frame, not multiple time frame.
Optional. Also WF on random space. This will do the entire range of the oscillators, instead of a range close to the original system values.
See walk forward for more details.
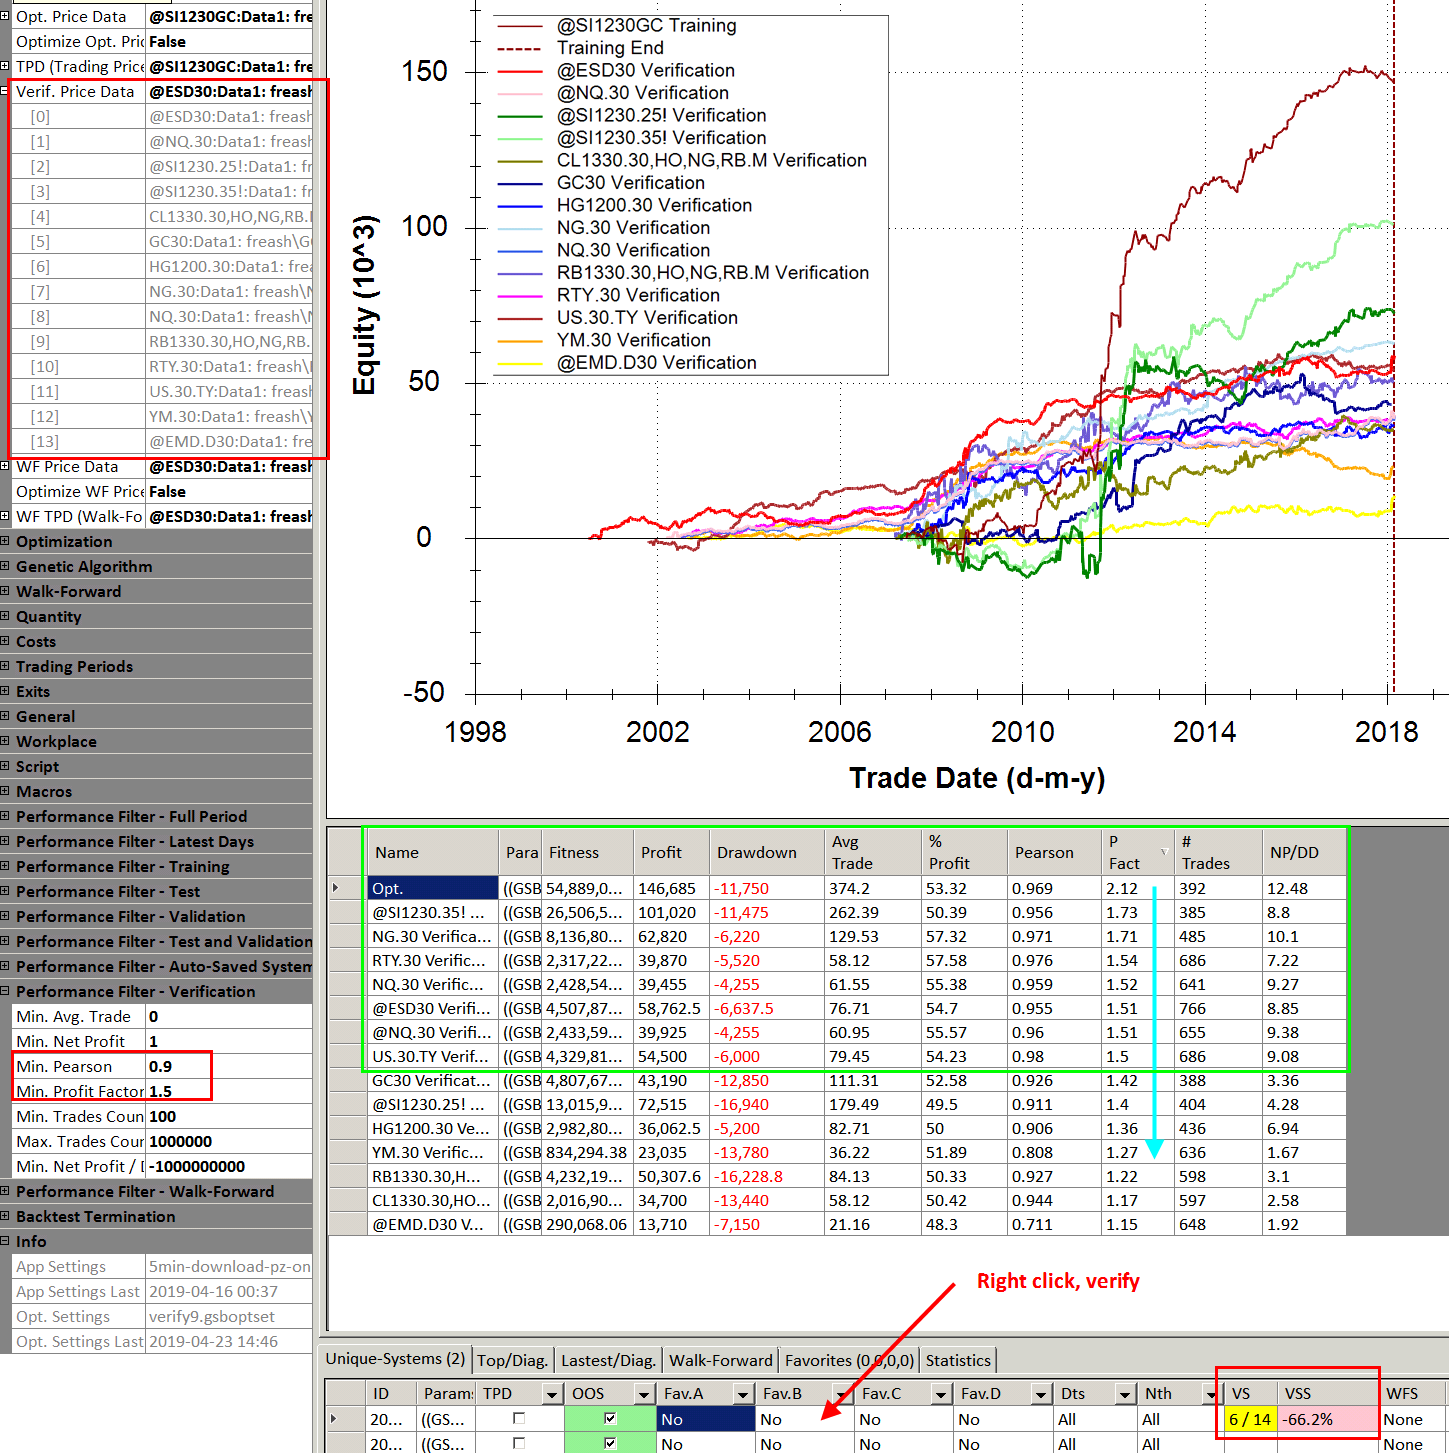
9) Market verification.
Optional, You may now choose to see how much the system degrades on other markets, other time frames.
Shown here, a 30 minute silver system works on 6 other markets, and silver 35 minutes.
To achieve such good results might be very hard to match. One of the reasons is the system shown was extremely simple.
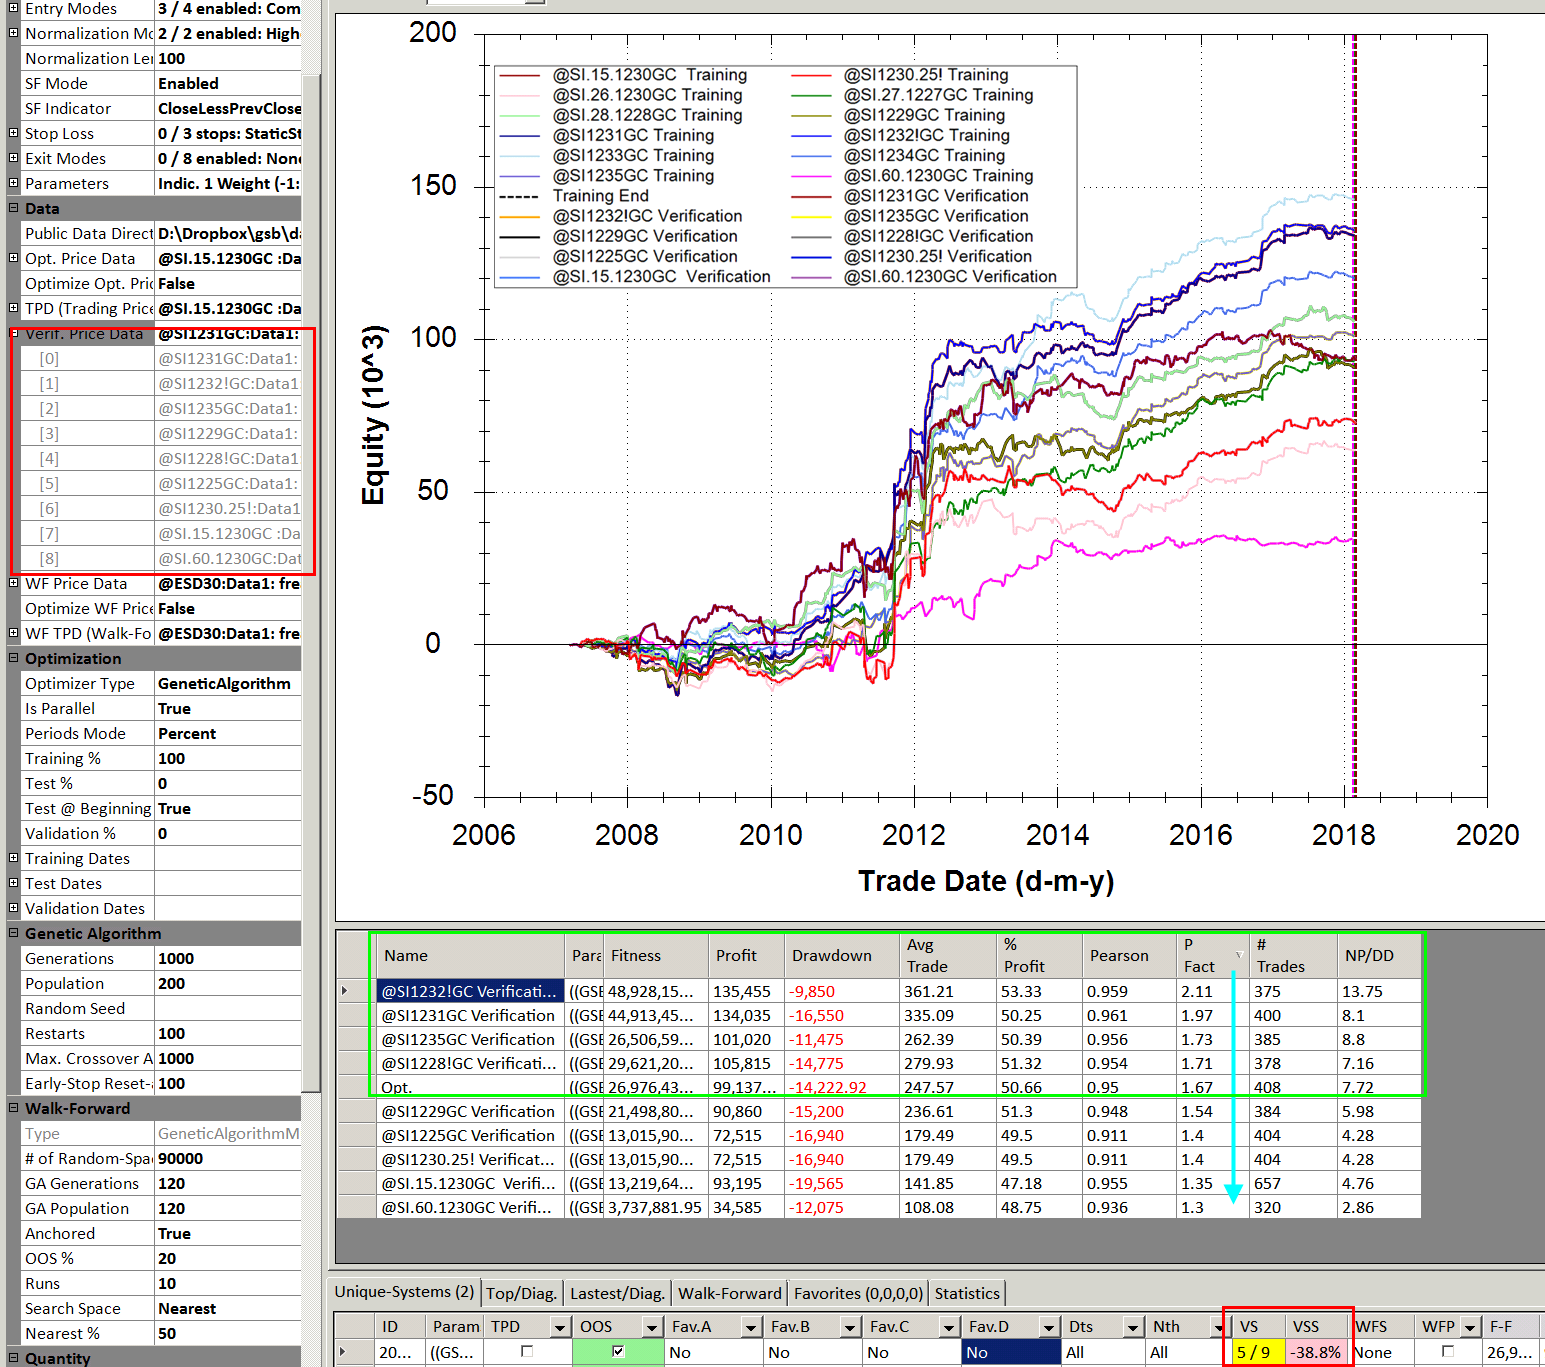
10) Verify on other time frames - Optional.
Shown below the silver system verified on 15,25,26,27,28,39,31,32,33,34,35,60 minute bars.
11) Further out of sample testing. - Optional.
If you have left a year for further out of sample testing, see the results now on the last year.
Optional leave for out of sample monitoring. As stated earlier, factor in if the market is performing well or poorly on other trading systems buy your self and or other vendors.