Advanced options
With Any indicator cross systems, they are really 3 systems in one.
The strength of this is you get more trades, more performance and better overall optimization of secondary / tertiary filters due to larger sample sizes.
The weakness is one of your indicators could be a bad performer, and this is indirectly hidden due to good performance of the other indicators.
In this section there is something that is simple and recommend to do. Test each indicator one at a time.
There is also some content on manual optimization of GSB systems in Tradestation. This is complex, time consuming and only recommend for experienced traders who know how to optimize well, and who have the human time to do it.
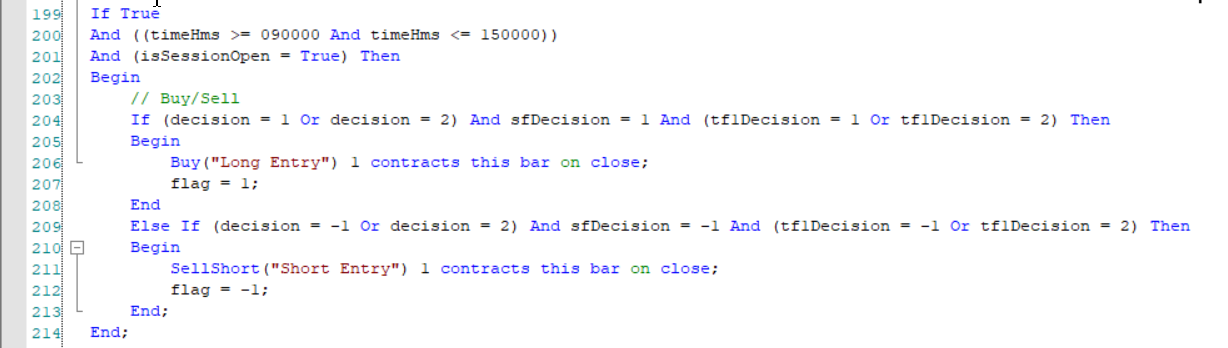
How to test each indicator
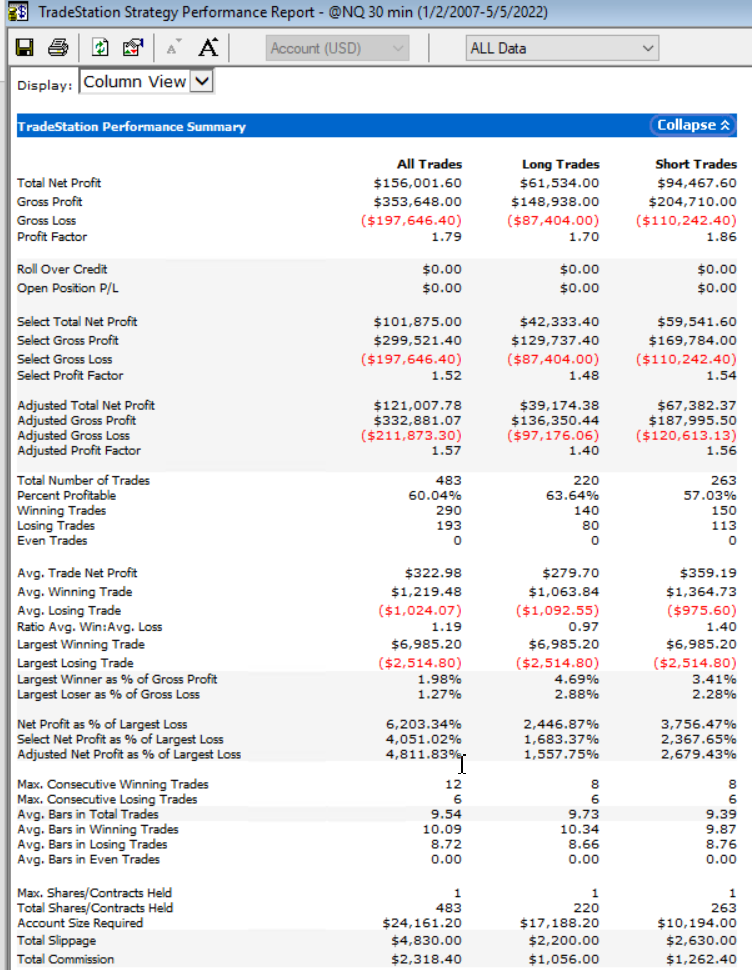
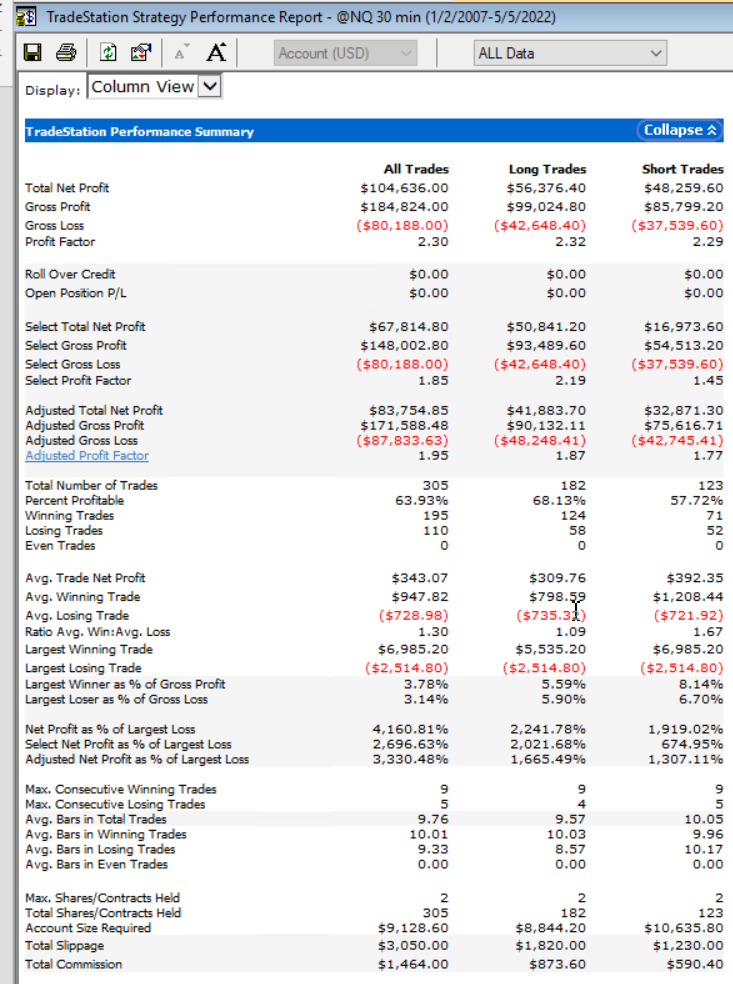
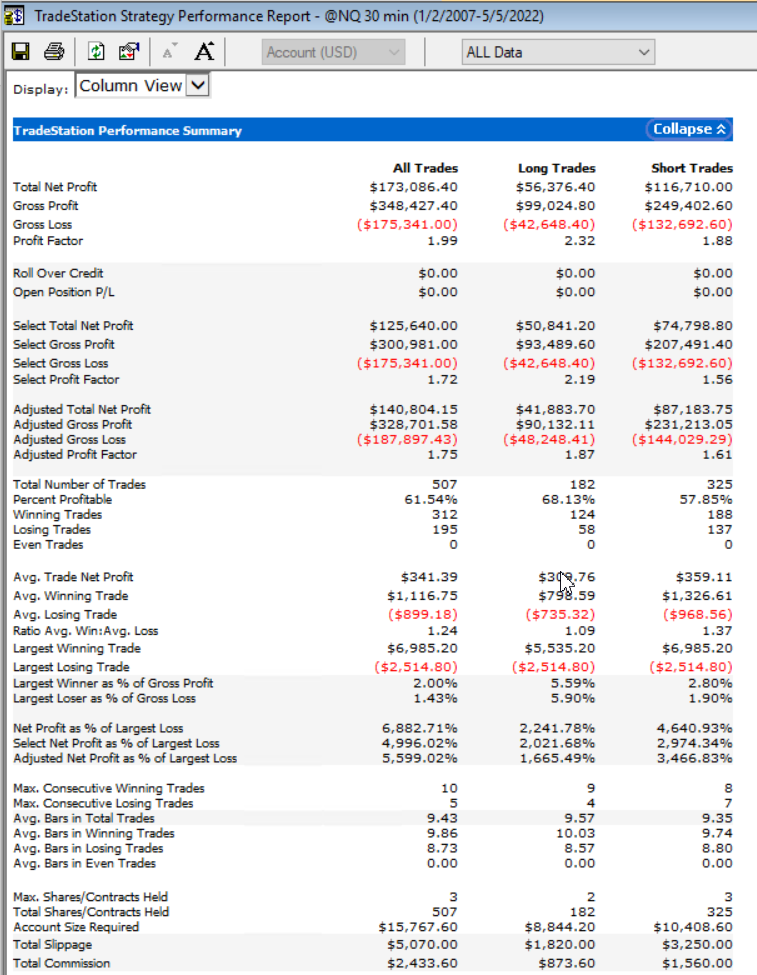
This is the overall performance of the system.
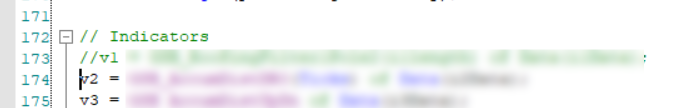
Now we will comment out the second and third inidcator
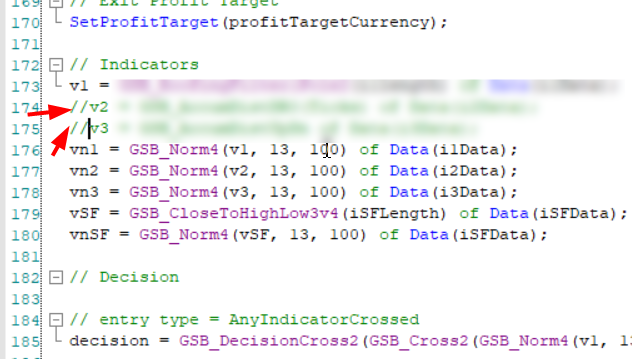
Note the results now.
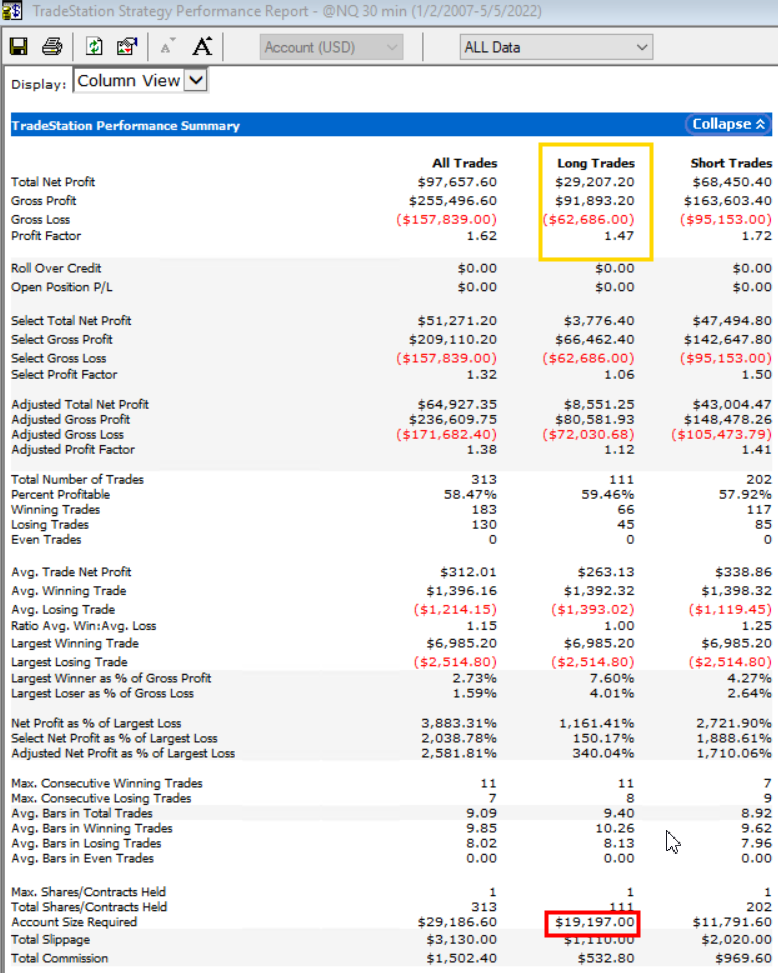
Long results are well below the average above. IE Profit factor has gone from 1.7 to 1.47, and it appears that much of the draw-down ($29186 long short, $19197 long) is caused by the first indicator.
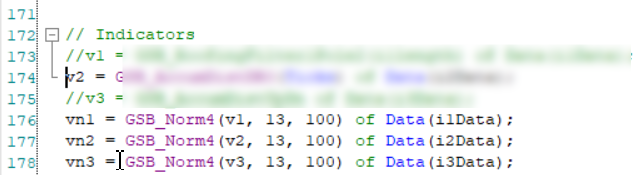
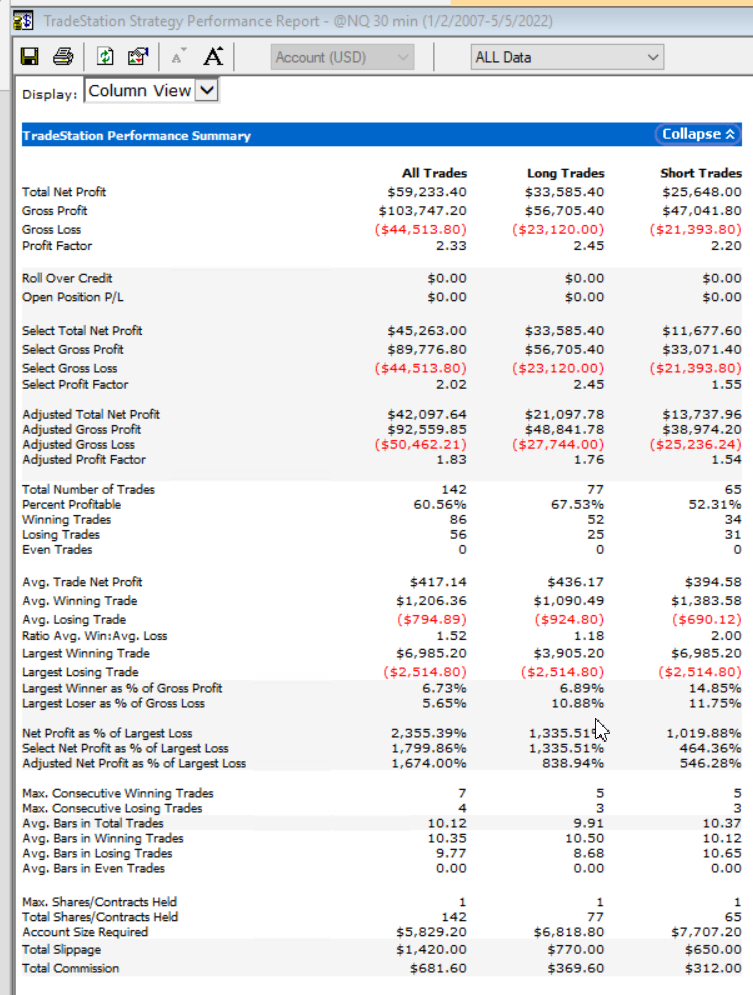
Now I comment out the first and 3rd indicator
Very good metrics below, though the profit $59223 is less than indicator 1 of $97657
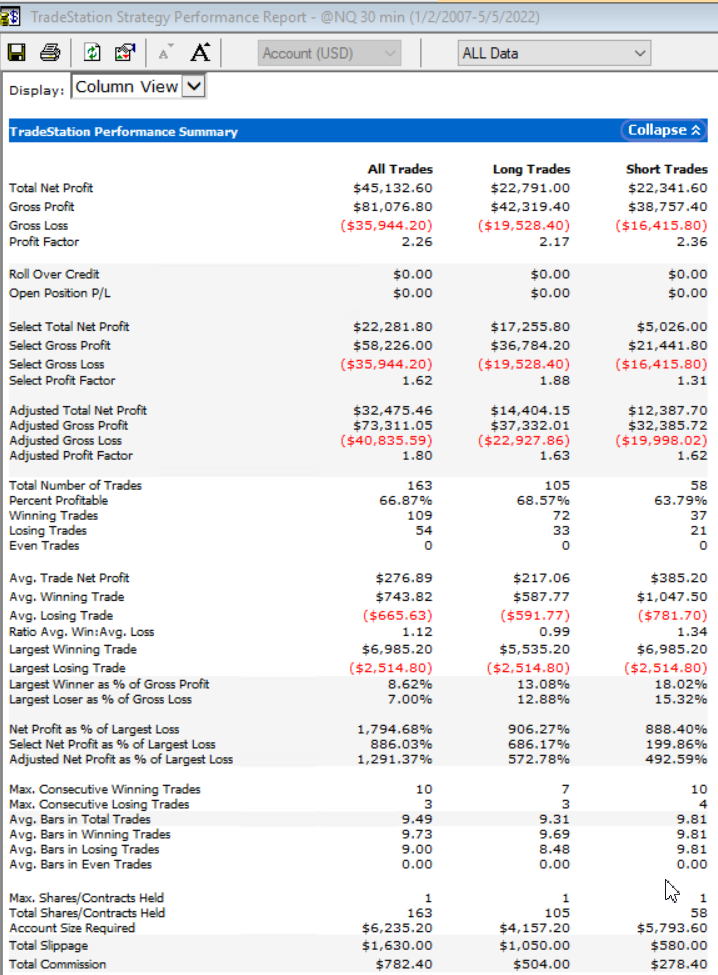
Now with indicator 1 & 2 removed
Good metrics again.
As I dont like the performance of indicator 1 so much, im going to look at the system with only indicator 2 and indicator 3.
This gives 1/2 the profit of the original system, but 66% less draw-down. Its tempting and valid to leave indicator 1 out. We will discuss this more later on.
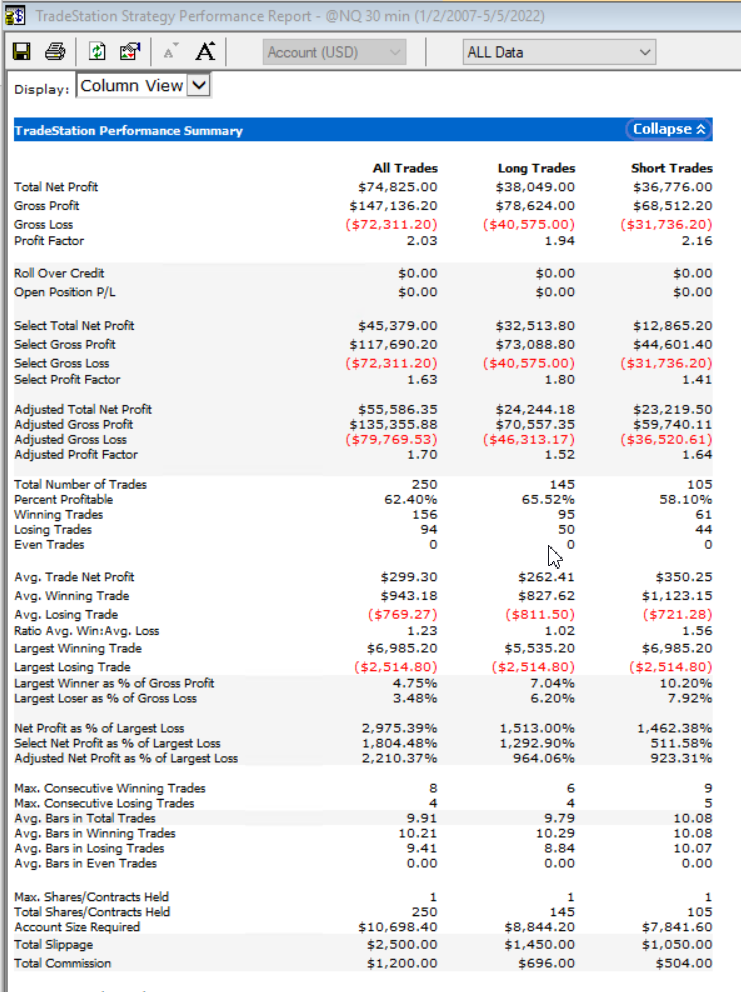
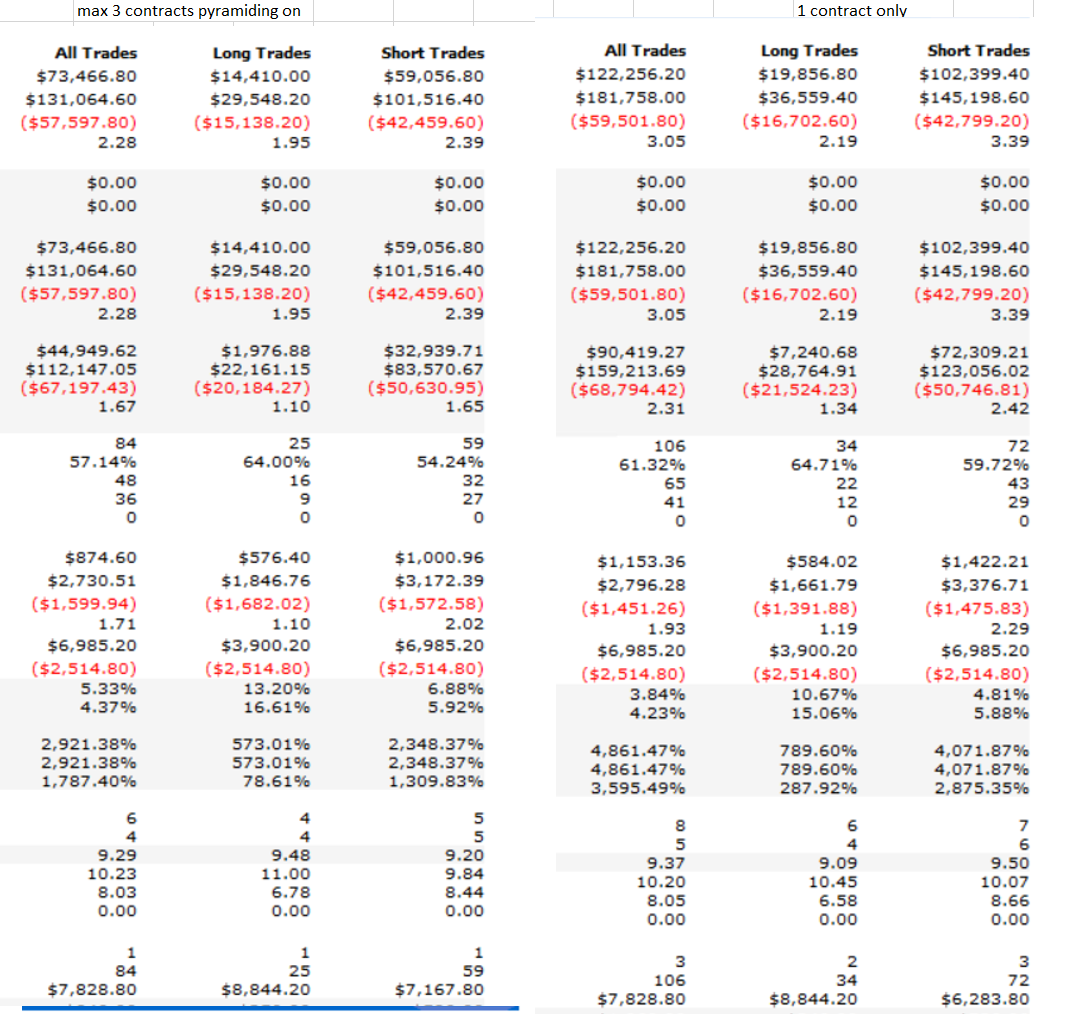
We are going to change this code here, to allow pyramiding of positions.
If your coding is correct, your results will equal $74,825 net profit. (The same as indicator 2 & 3 used only)
Now change your chart to these settings to allow pyramiding.
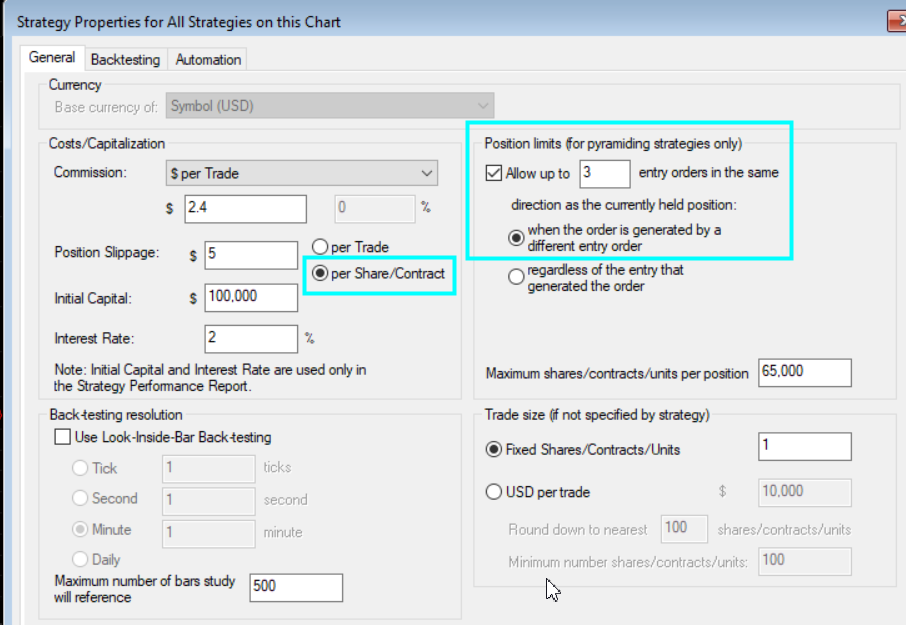
Now look at the results. This compares well to all other metrics we have had in previous combinations of coding indicators.
Remember earlier on how inidcator1 long was weak in results.
I now have added indicator 1 back - so all 3 indicators are used, but commented out the long entry of indicator 1
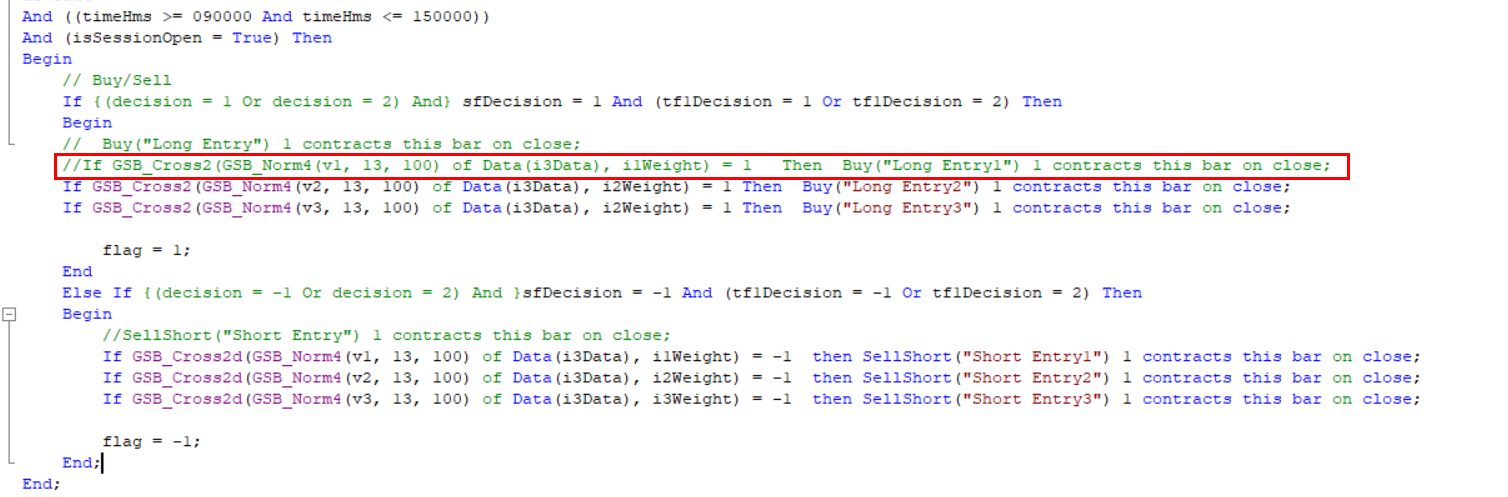
Results are much improved from the original
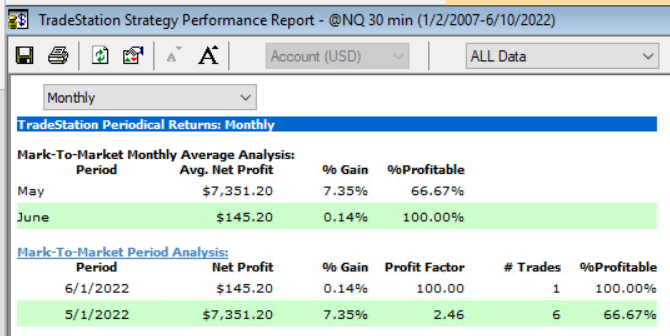
With no pyramiding, these were the hypothetical results. May 5 2022 to 10 June 2022
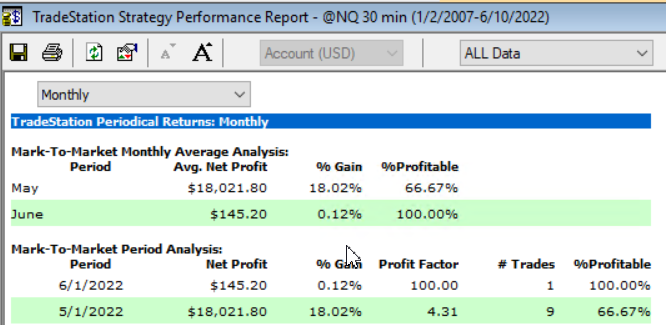
With pyramiding on, this is what the hypothetical out of sample results were. May 5 2022 to 10 June 2022
Note, all the initial indicator variables used in this code were the default variables that GSB found after a walk forward.
As this was a learning exercise for me, I spend numerous days work and manually optimized all inputs without pyramiding,
then used the approximate range found for a complete optimized in Tradestation.
I repeated the same process with pyramiding on while optimizing.

What you can see is the system out of sample performance was much better when optimized with pyramiding on. One systems is not conclusive evidence that optimized with pyramiding on is the best policy, but common sense would say optimizing
with more trades, without having trades from one indicator inhibited - would work better.
I am not going into detail over exactly how to do a manual walk forward of GSB in Tradestation.
The reason is it is very (human & support) time intensive, requires significant skill and experience. Unless you are very experienced, do not attempt to do this.
However the steps to test one indicator at a time is both fast & simple to do, and fine for in-experienced users to do.
This system shown will be offered for sale after live incubation period.
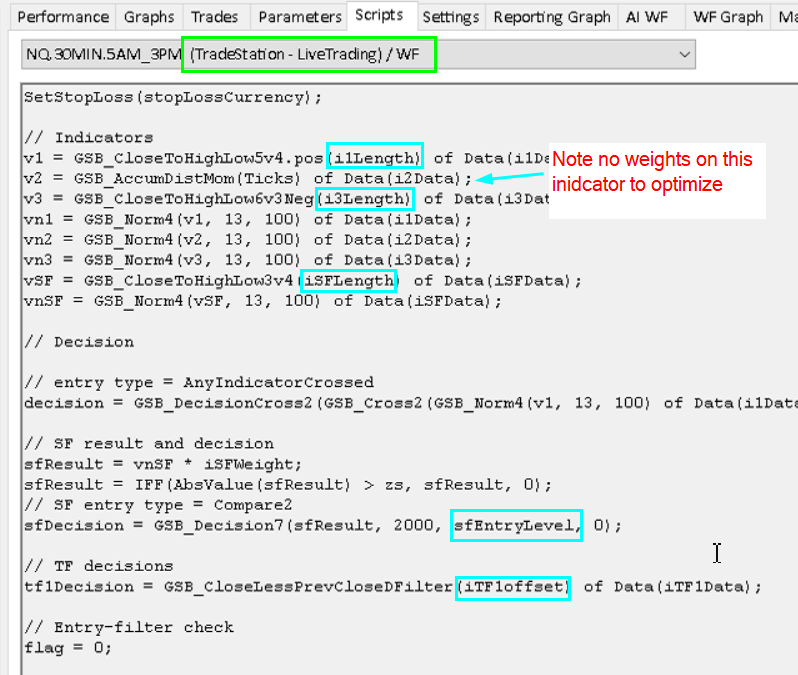
Basically what has to be done for a manual walk forward of AIC (Any indicator cross) system is to WF all indicator lengths, including secondary filters. Weights are NOT optimized.
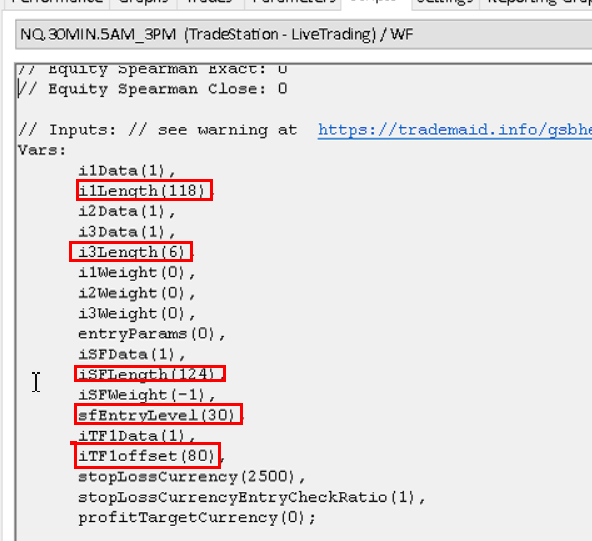
Below is and example of what should be optimized in TS.
Each indicator must be done, one at a time. Then you choose the range likely to be required.
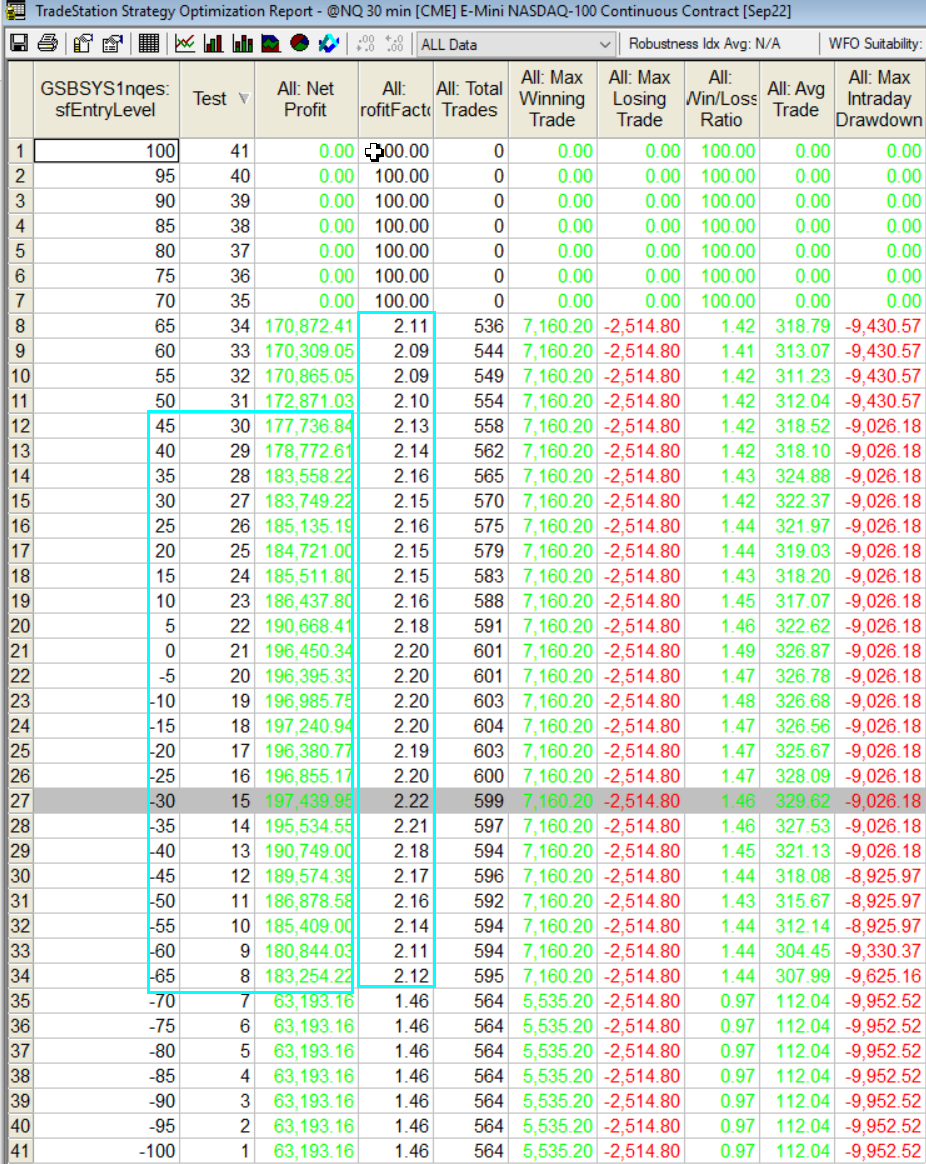
Here is SFentrylevel being optimized.
The net-profit seems best from -65 to + 45. Profit factor best from -65 to 65. Draw-down stable through the entire range of -65 to 65
So we would use -65 to 65 in Tradestation for this variable. This is super high level and just the tip of the ice burg on the knowledge required.
It is such a big and complex topic, a whole course could be devoted to this. Should it be done, it would be a paid course as its a bottom less pit of support issues and outside the scope of GSB support.
Manual optimization topic concluded for now as its a very big subject with lots more to know.
DISCLAIMER
HYPOTHETICAL PERFORMANCE RESULTS HAVE MANY INHERENT LIMITATIONS, SOME OF WHICH ARE DESCRIBED BELOW. NO REPRESENTATION IS BEING MADE THAT ANY ACCOUNT WILL OR IS LIKELY TO ACHIEVE PROFITS OR LOSSES SIMILAR TO THOSE SHOWN. IN FACT, THERE ARE FREQUENTLY SHARP DIFFERENCES BETWEEN HYPOTHETICAL PERFORMANCE RESULTS AND THE ACTUAL RESULTS SUBSEQUENTLY ACHIEVED BY ANY PARTICULAR TRADING PROGRAM.
ONE OF THE LIMITATIONS OF HYPOTHETICAL PERFORMANCE RESULTS IS THAT THEY ARE GENERALLY PREPARED WITH THE BENEFIT OF HINDSIGHT. IN ADDITION, HYPOTHETICAL TRADING DOES NOT INVOLVE FINANCIAL RISK, AND NO HYPOTHETICAL TRADING RECORD CAN COMPLETELY ACCOUNT FOR THE IMPACT OF FINANCIAL RISK IN ACTUAL TRADING. FOR EXAMPLE, THE ABILITY TO WITHSTAND LOSSES OR TO ADHERE TO A PARTICULAR TRADING PROGRAM IN SPITE OF TRADING LOSSES ARE MATERIAL POINTS WHICH CAN ALSO ADVERSELY AFFECT ACTUAL TRADING RESULTS. THERE ARE NUMEROUS OTHER FACTORS RELATED TO THE MARKETS IN GENERAL OR TO THE IMPLEMENTATION OF ANY SPECIFIC TRADING PROGRAM WHICH CANNOT BE FULLY ACCOUNTED FOR IN THE PREPARATION OF HYPOTHETICAL PERFORMANCE RESULTS AND ALL OF WHICH CAN ADVERSELY AFFECT ACTUAL TRADING RESULTS.