What are you looking for in Walk Forward Results?
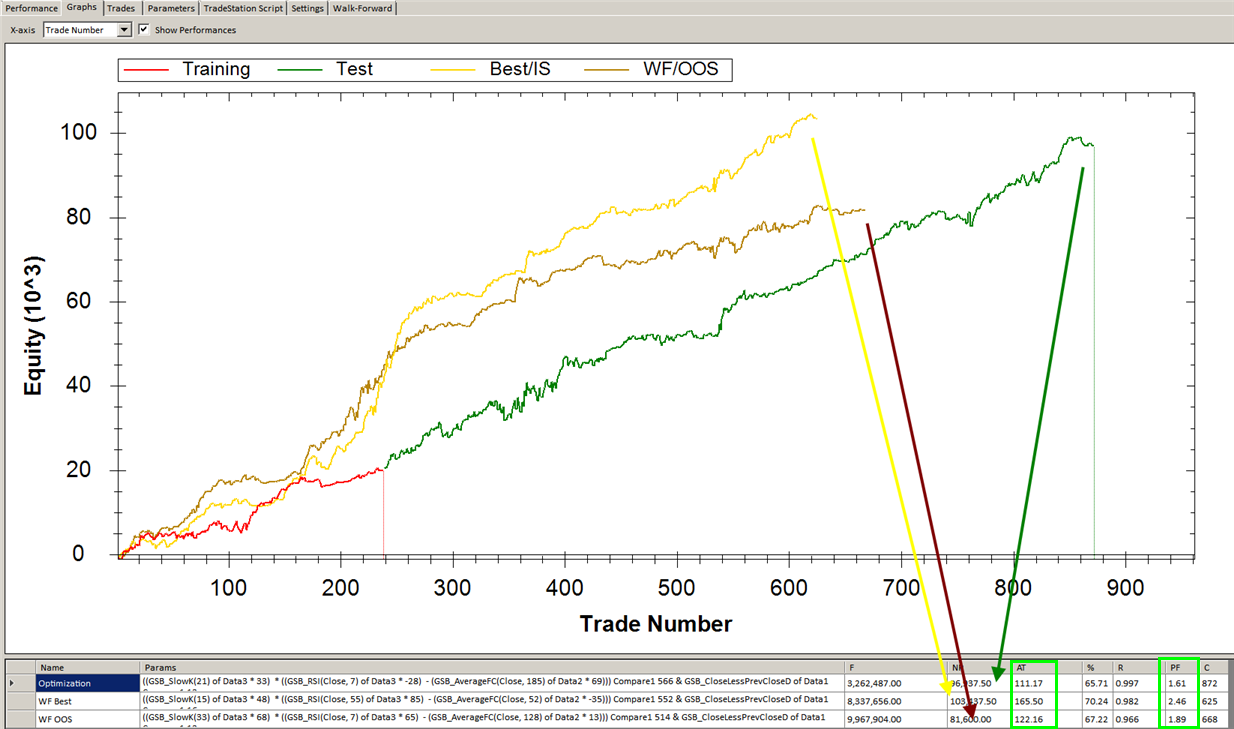
The OOS curve (out of sample) should be above the original curve, linear, and the profit factor and average trade as good as or better than the average curve. The average trade must be higher enough to cover brokerage and 1 tick each side slippage. (more for ill-liquid markets)
Another thing we look for in a WF test, is the parameters being stable in the last approximate 25%+++ of WF runs. Also we like to see the IS curve and OOS curves to be roughly parallel. For more detail on this see my youtube video https://www.youtube.com/watch?v=CQy-yP_kBMM
An acceptable result is shown below. Note how the Average trade and profit factor have increased in the IS and OOS curve. This is somewhat at the expenses of net profit and number of trades. This is still very acceptable. Different fitness specs will vary these results a fair bit. If an identical second WF gives fairly different results, you need to have more iterations done. (increase WF Generations / population)
Beware where the number of trades doubles or triples on the OOS result. Adding commission fitness may help this, and using the default fitness of Netprofit * average trade.