Verification
VS is the number of verification price data that pass the performance metrics.
VSS is the amount the average of all verification price data degrade from the original Opt Price data file.
My own testing showed VSS to be better than VS. I use verification data of 4 data streams, 5 ticks random noise, and 4 data streams with 10 ticks of noise.
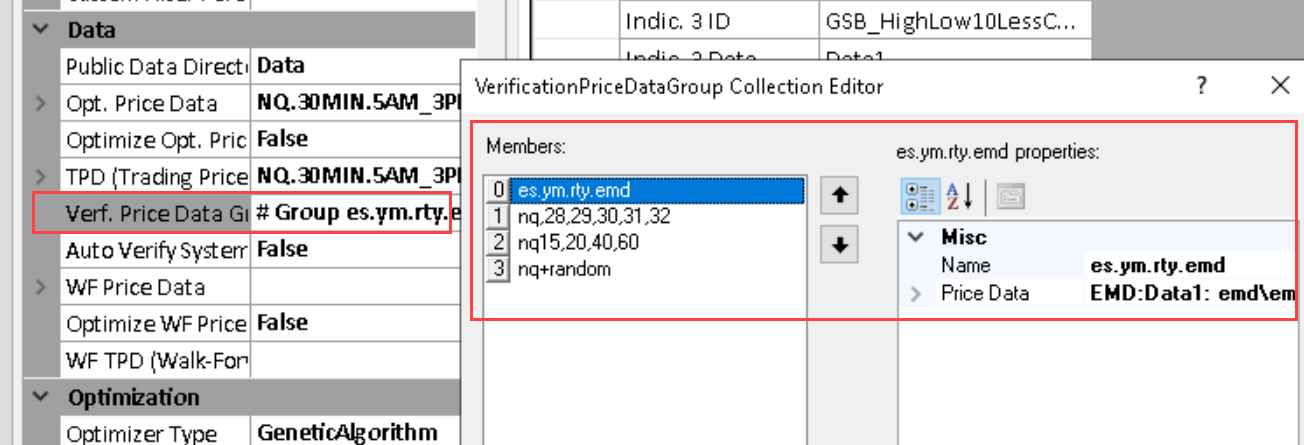
As of build 68.45 it is now possible to do groups of verification.
In this example ES,EMD,YM,RTY were one group, NQ30 with random noise another group, NQ 28,29,31,32 another group and NQ15 minute, 20 minute, 40 minute another group.
The totals of all VS groups now go into VS and the average of all VSS.
To verify, right click and use verify - will verify all groups.
To verify only one group, select verify group.

The VS score is derived from the Performance filter verification metrics below.
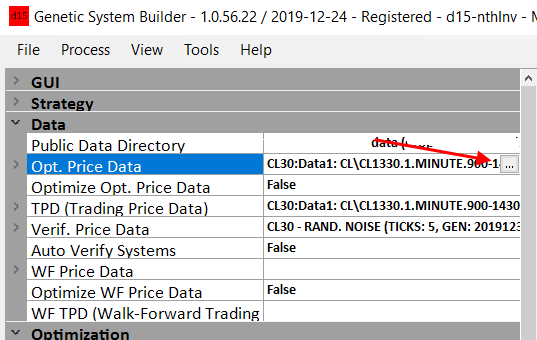
Verify Price Data
This data is used in Verification. To add Verify Data/Filter you need to add the data same way you load the Price data.
You can also add random noise to the verification data. It is recommended to add 4 data streams of 4 ticks random data, and 4 data streams of 8 ticks random data.
Follow the steps below to do this. There is more information on this here and here.
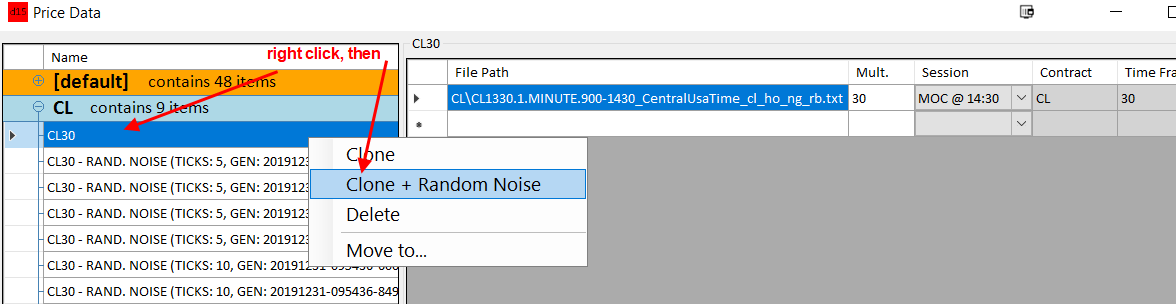
Change clones to 4, and ticks to 5. Repeat the process with ticks 10
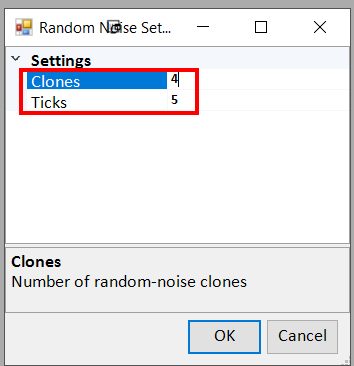
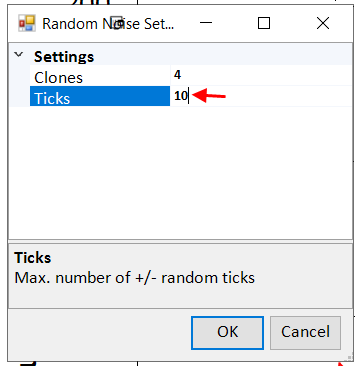
It may take a minute to make the random data.
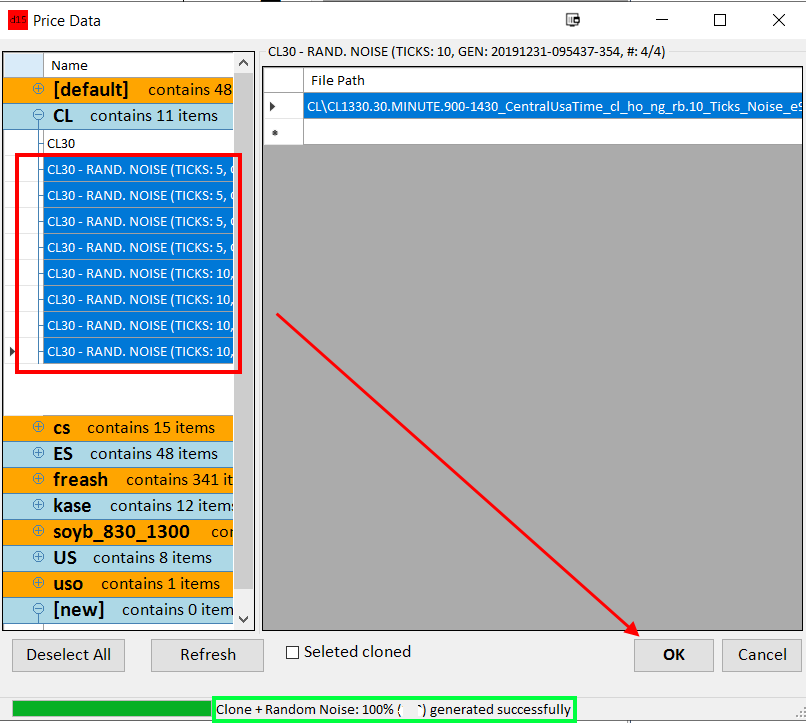
Once its done, select the data and click ok.
The logic is, if a system passes verification with random noise on the data, and or using multiple time frames, it is much more robust and likely to work out of sample. For a 30 minute system, verification of all bars from 25 to 35 minutes is a good test. A important setting is under performance filter, verification. The default is profit factor of 1.8, and pearsons of 0.85. You may choose to adjust these settings a little if needed. If to few systems verify, reduce these values. If you have to many systems, increasing pearsons to 0.95 will help.
Note: your charts on TS must be on local time to have more than one data stream. If your computer isn't on Central USA time zone, to add more data streams they must all be on the same time zone. (Including data1) If you get this wrong, then data streams may be looking into the future and delayed. All results will be invalid.
If you have say 330 minutes in a day, and you have 30 minute bars, there are 11 bars in a day. If you then use 29 minutes, this makes 12 bars in a day. 31 minutes makes 10 bars in a day. These differing bar intervals stress test the GSB oscillators, reducing the tendency to over curve fit. If you choose other intervals, its is recommend that you get a different number of bars above and below the central time frame. For more detail on the significant implications of this, look at the market validation videos. https://trademaid.info/video.htm This is a very important video.