Families
Families
Once we have completed all the previous sections and have built our systems using our best indicators we can look at families of systems. Families are systems that share the same indicators but the parameters may be different.
First run macro 2 to set dates to the in-sample period 1900-01-01 to 2018-02-28. The macro 2 is m2-alldatesto20180228.gsbmacro
It is critical to create families using the in sample data, so always run macro 2 first to make sure.
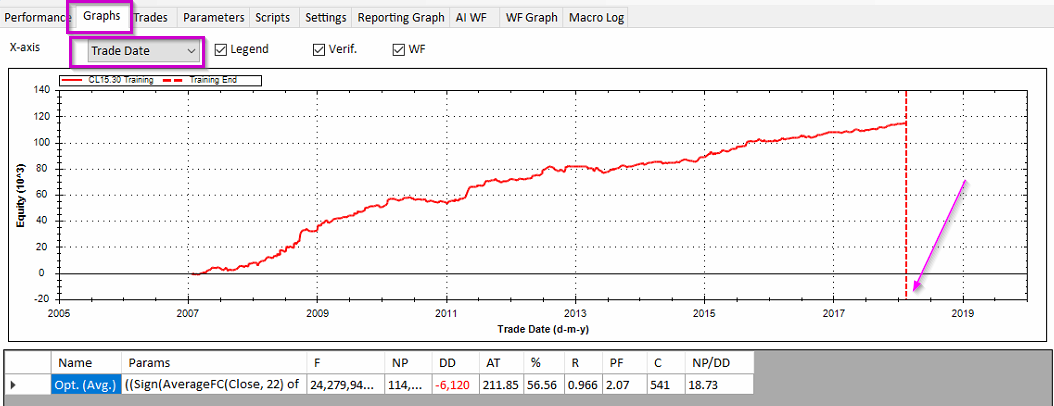
If we go the the Graph Tab in the upper window and set the x-axis to Trade Date we see the graph ends at 2018-02-28, the end of our in-sample period.
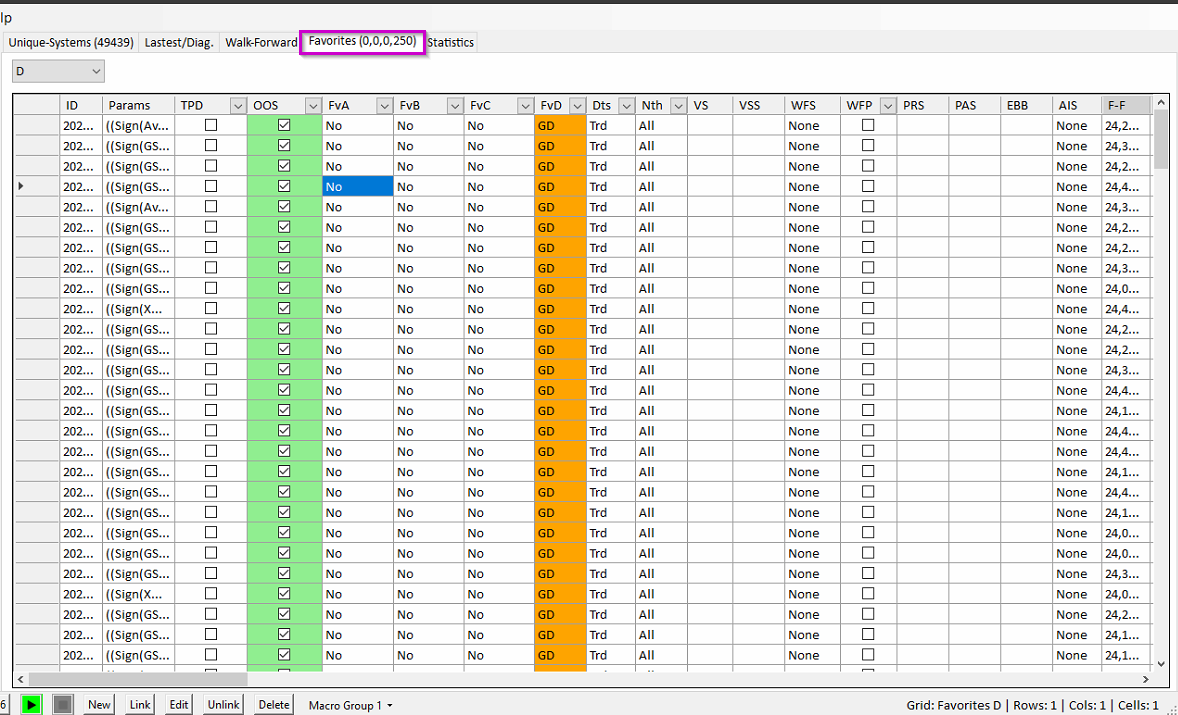
Next click on the Favorites tab. Macro M1 in the previous section put the top 250 systems in Favorites D
Later note the macro was changed to use Favorites A
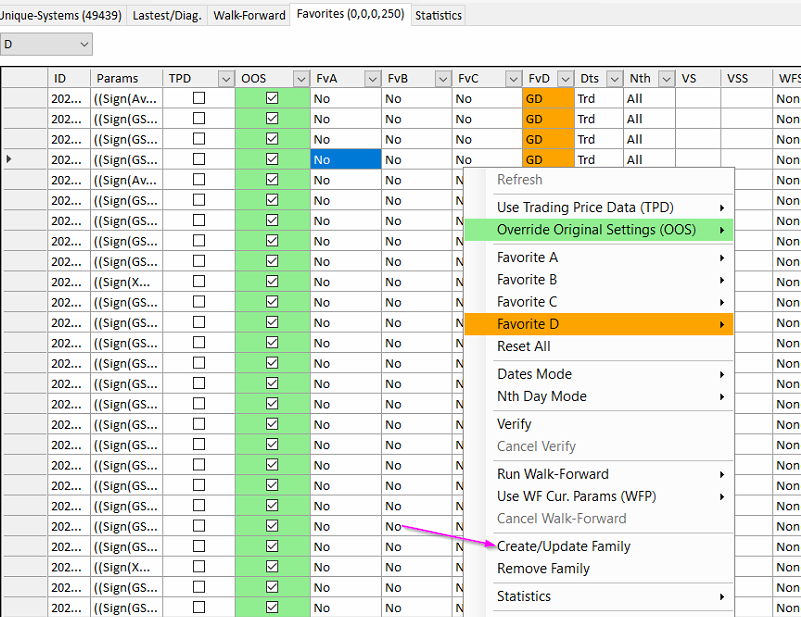
Hit Alt-B the hide the upper window and Alt-R to hide the right-hand column
Then with the cursor inside the panel, right click the mouse and select Create/Update Family
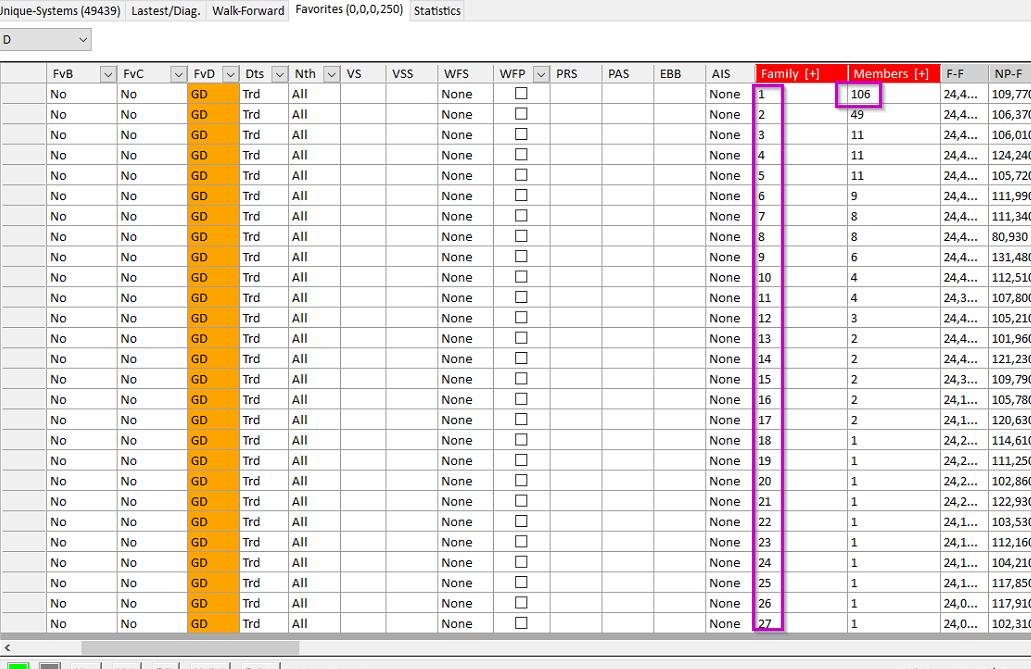
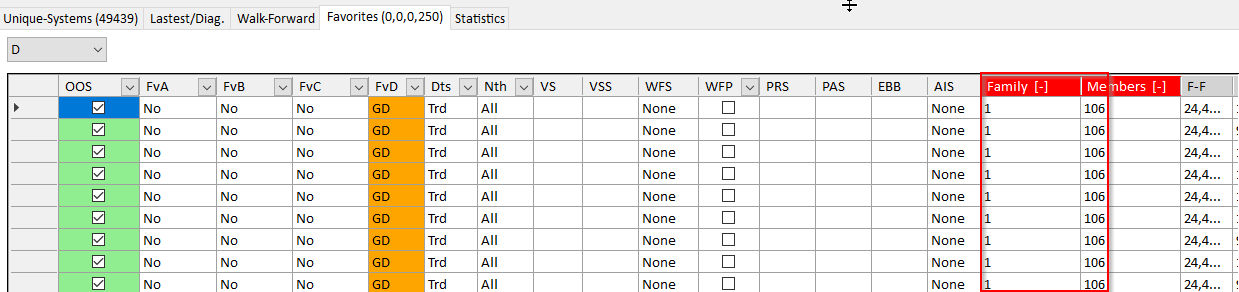
This now shows we have 27 families. Family one has the largest number of members at 106
To see the parameters of a family hit Alt-B to unhide the top window and click of the Parameters tab.
Then click on the family line you want to inspect in the lower Favorites window

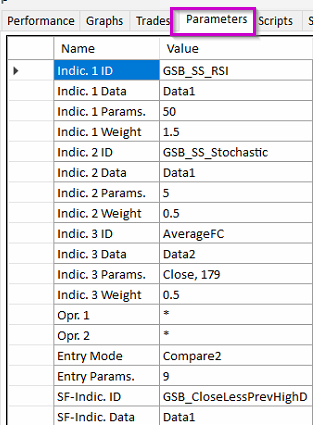
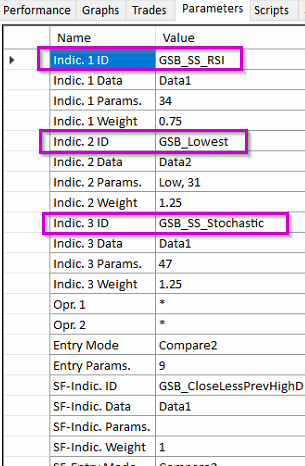
and the parameters for that family are shown in the upper Parameters window. It will show the indicators used.
We can expand expand the Family column by clicking the column header

and that then shows all the systems in the family
If you click on the various systems within Family 1, you will see they all have the same three indicators (they might show up in different order). The parameters will be different for some or all of the indicators.
With 106 members in Family One out of the 250 top systems, Family One is a fairly robust set of systems.