Running Stats on Built Systems
Running Stats on Built Systems
After we have built 50,000 systems we will run the statistics by running macro 1
Click M1 button at the bottom of the window the load the macro and then click on the small green aroe icon just to the right of the M6 button.

The progress will be shown in the Macro Log tab
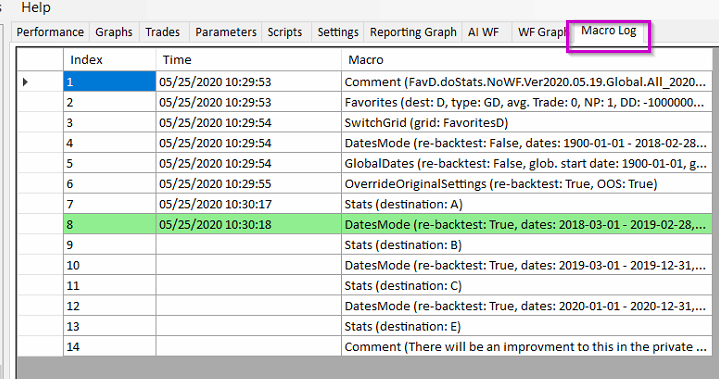
This will take the top 250 systems and put them in Favorites D

It puts the in-sample results in Destination A , 1900-01-01 to 2018-02-28

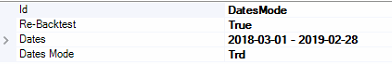
It puts the first out-of-sample results in Destination B, 2018-03-01 to 2019-02-28
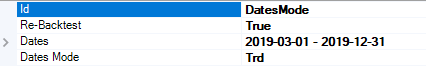
It then puts the second out-of-sample sample results in Destination C, 2019-03-01 to 2019-12-31

And finally it puts the remaining period 2020-01-01 to 2020-12-31 in Destination E
We can see the results in the Statistics tab
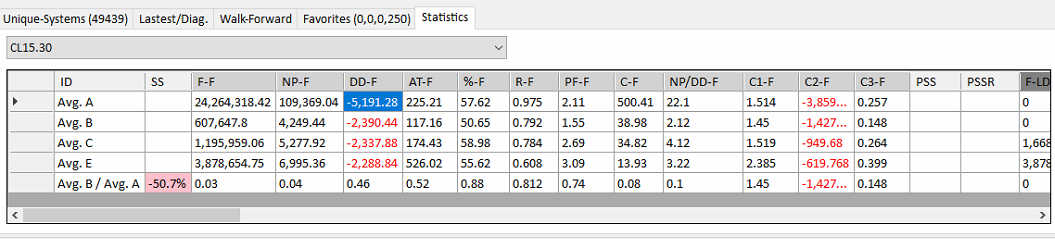
We can see that is the first out-of-sample period (2018-03-01 to 2019-02-28) we made $4,249.44 with a draw down of minus $2,390.44 with the average trade $117.16 profit with no slippage or commission and a profit factor of 1.55.
For the next out-of-sample period (2019-03-01 to 2019-12-31) we made $5,277.92 with a draw down of minus $2,337.88 with the average trade $174.43 profit with no slippage or commission and a profit factor of 2.69