Determine the Best Indicators
Determine the Best Indicators
50,000 systems should be made. Every alternate 80 days was in sample. When the systems are in GSB we are only looking at the out of sample data
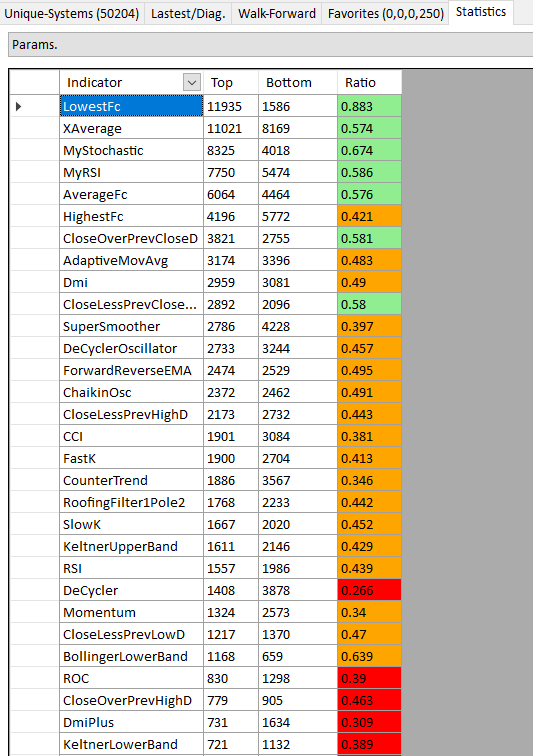
Statistics is going to look at the top 1/3 and bottom 1/3 of the 50,000 systems
For an indicator to be green it must appear in the top 1/3 compared to bottom 1/3 50% or more of the time.
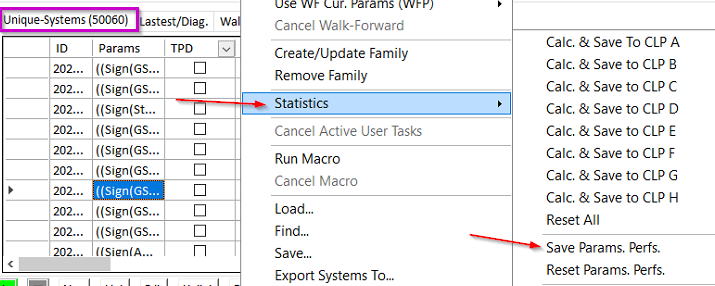
Place the mouse cursor anywhere within the Unique-Systems window, right click the mouse, select Statistics and then click Save Params. Perf.
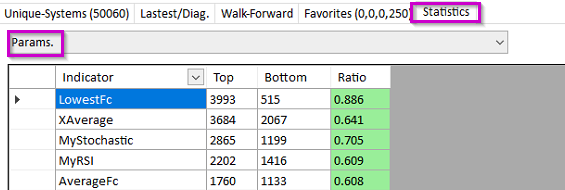
We now select the Statistics tab by clicking on it and in the dropdown box select Parms.
Use Alt-B keys to hide the upper window
We can now see the performance of the indicators.