Crude oil fast & revised methodology
This is the quick way to build crude oil systems. Some of the more in-depth details are skipped, but can be found in Crude oil methodology setup.
Latest macros can be found here.
Find the best indicators. 2 pass method.
Updates 24 March 2020. This section now complete but will still get updated over time.
This is significantly tweaked to how this has been done in the past.
It is faster as far as CPU time goes, but has a few more steps
Basically we do the first build of 50,000 systems with TWO indicators in each system, and we remove the very worst (red) ones.
The we use the remaining indicators and build another 50,000 and only take the best (green) indicators.
What we are doing in effect is building 50,000 systems. We are using 80 days in sample, and the next 80 days out of sample. (re-occurring & dates before 2015.6.30)
We then pick the best indicators in the top 50,000 out of sample results and omit the worst indicators in the bottom 50,000 systems.
The following features are unique to crude oil (as possible the energies)
i) 15 min data1, 30 min data2. Normally 30 minutes is best.
ii) We use the data, but don't trade the first hour
ii) Only compare2 entry type used. Other markets may be compare1,2 or a cross entry type.
iii) The secondary filters used are NOT any of the closed(1){/ or -} close
iv) Only center scaling normalization is used.
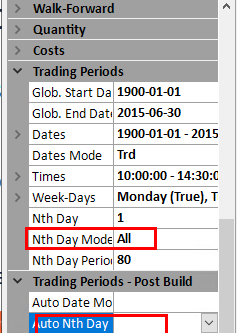
v) Nth feature is not used in system building. (It is used in finding the best indicators.)
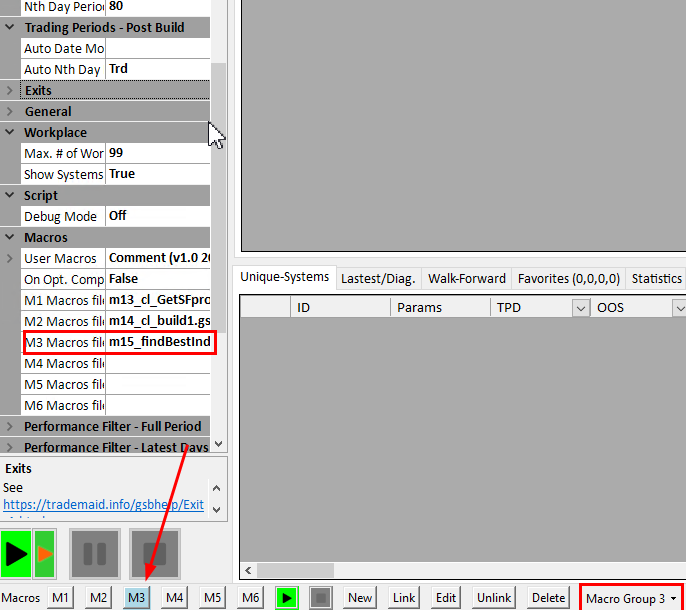
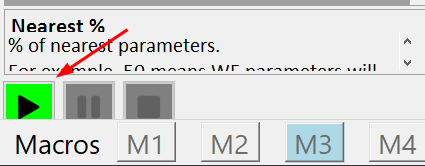
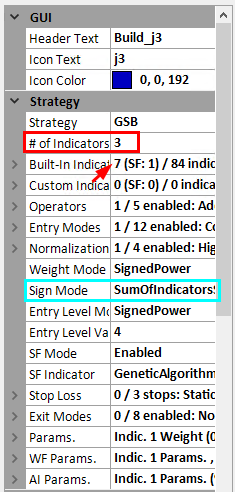
1) Get the correct settings.
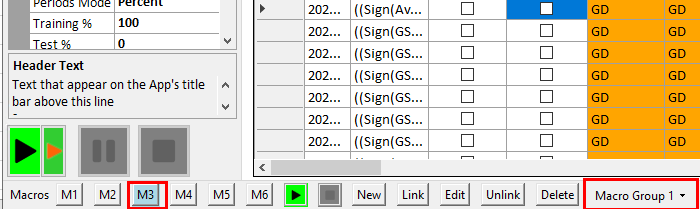
run macro15, (m3.group3)
This will give you all the correct settings for crude oil. Likely the correct settings for all energies, but NOT for other markets.
What is very significant is we are using two indicators (per system), not the normal three for building systems, or one indicator in the legacy method of finding best indicators.
Should you use your own data, its critical not to trade in the first hour. Our data is 9:00 am to 2:30 pm exchange time, but our trading periods is 10:00 am to 2:30 pm

The secondary filter used in the macro is GSB_CloseLessPrevHighD
Any of these 4 secondary filters below can be used, BUT DO NOT USE ALL THESE 4 SECONDARY FILTERS AT ONCE. Use one at a time.
Results will degrade a lot if you use all secondary filters at once. Each secondary filter will give less correlated systems to each other.
I would expect closelessPrevHighD/ CloseOverPrevHighD to be less correlated to closeLessPreveLowD, CloseoverPrevLowD
Note the trial version of GSB has about 44 (2 are redundant) indicators. Beta testers get about 82/84 indicators. In this example we are only using the 42 indicators.
Over time the indicators in the beta version will be in the trial version. (if they perform well)
The two stage indicator method is even more important if the additional indicators are used.
Below are the secondary filters we may use.
2. Build 50,000 systems.
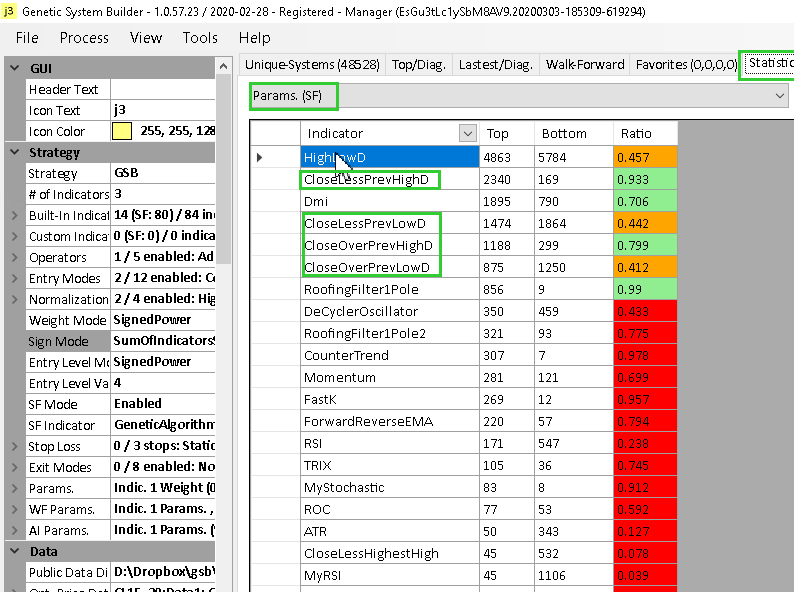
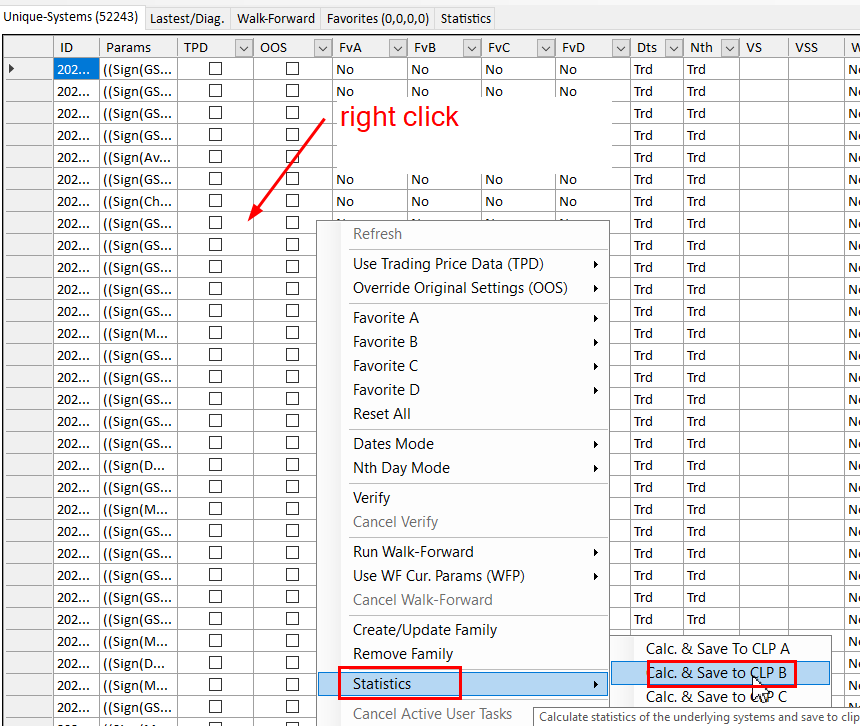
3. Pass1. Get indicator statistics.
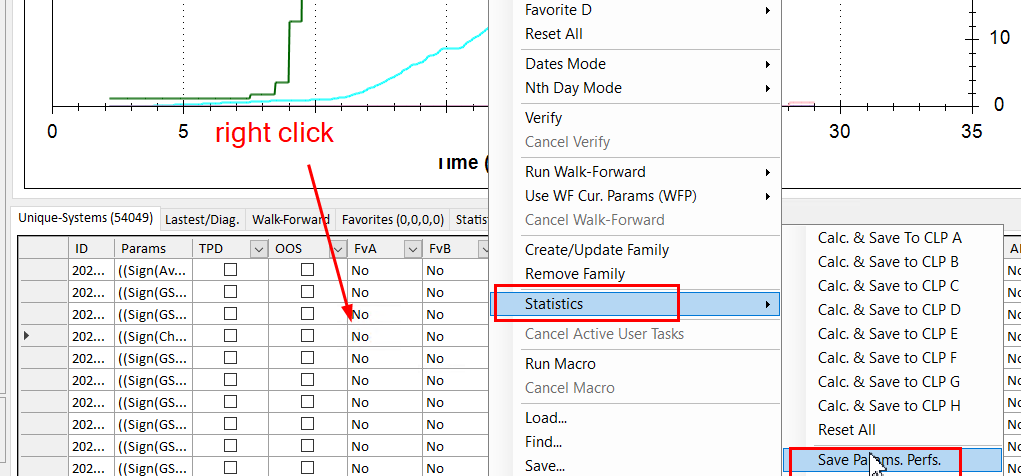
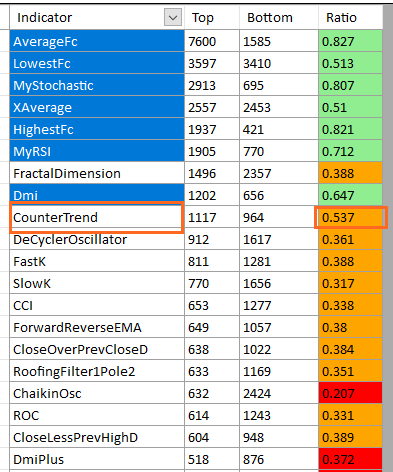
Here are all the indicators from save parameter performance.
We want to choose all in green and orange. Do not choose the red ones.
This is the first pass of two pass's.
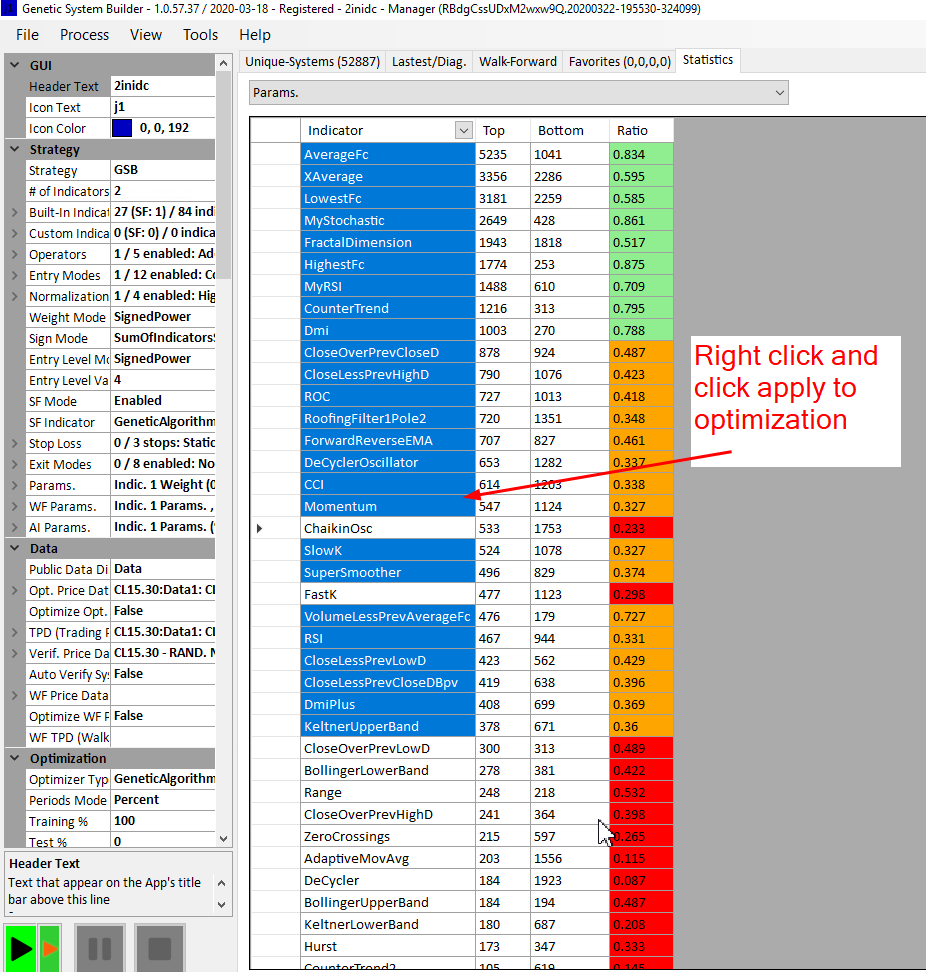
click on the top row with the mouse, hold down shift, then click on the last orange indicator.
Then use control mouse click to de-select the red ones.
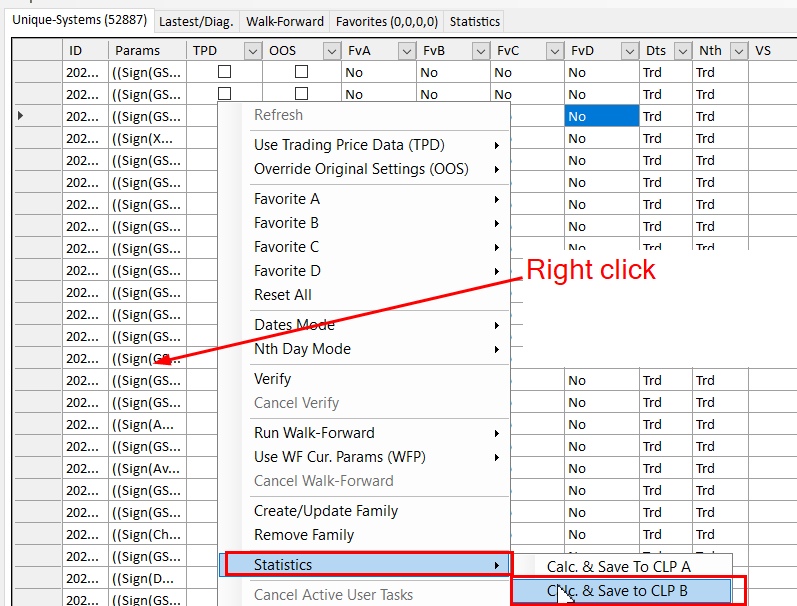
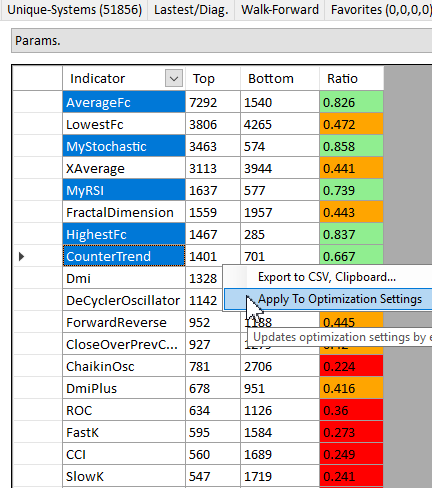
Right click and hit apply
Step 3b. Optional. Get statistics of the out of sample indicators.
This figure of 3074 below should go up when pass 2 is done.
Note the figure 3074 for later.
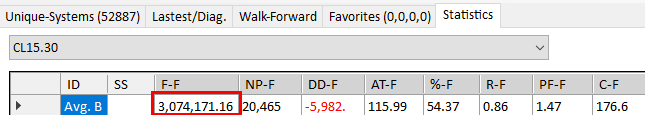
The indicators have dropped from 46 to 27.
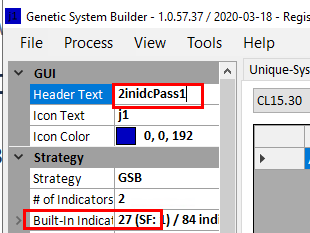
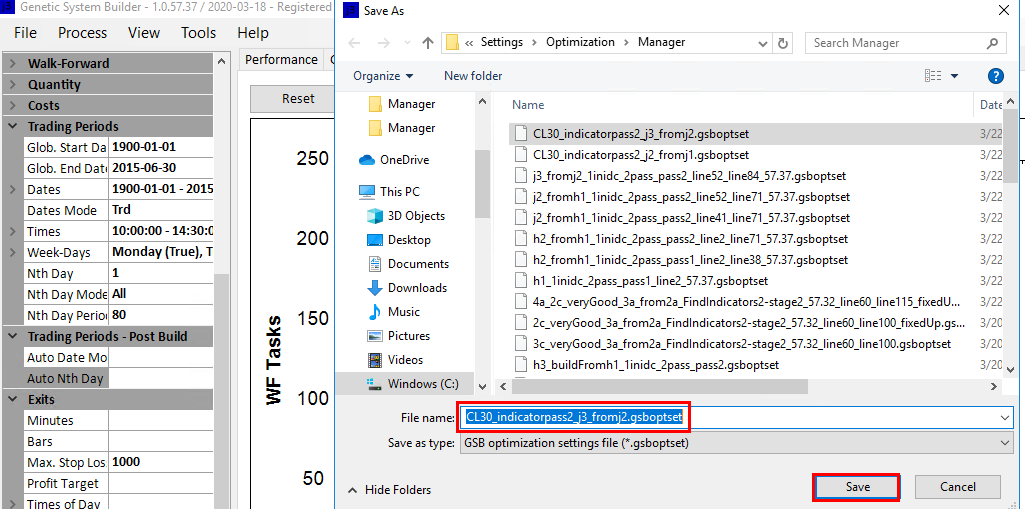
Save your opt settings as CL30_indicatorpass2_j2_fromj1. File save opt settings. (not app settings)
Open a new manager. (If you have low ram free, close the previous manager that was used)
This should load the settings just saved.(CL30_indicatorpass2_j2_fromj1)
Step 4. Pass2. Build 50,000 systems now with the 27 (or similar number) indicators.
Do the statistics just like was done in step 3 above. The difference between step 3 & step 4 , is step 4 has less indicators. Everything else is the same.
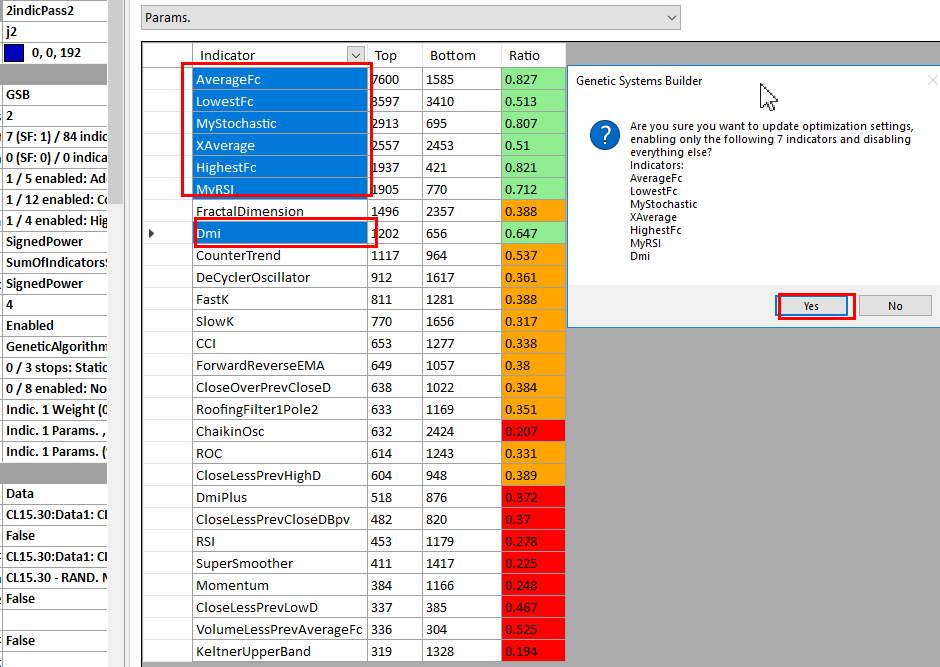
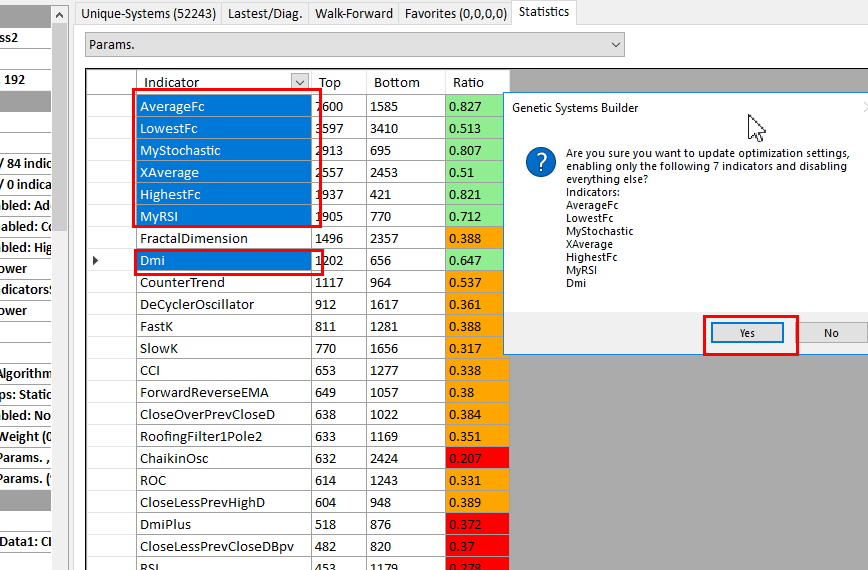
We then got these indicators, 7 in green. Exact number & type of indicators may vary a little.
Should you get too few indicators (if there is such a thing as too few) you could expand the list to indicators in orange with a ration over 0.5
Identical tests will give some variation in results, and the amount of indicators in GSB is increasing over time, so this will vary results.
Note in the case below, only one indicator was orange and had a ratio over 0.5.
Select the green ones only. (last time it was green and orange)
Hit yes
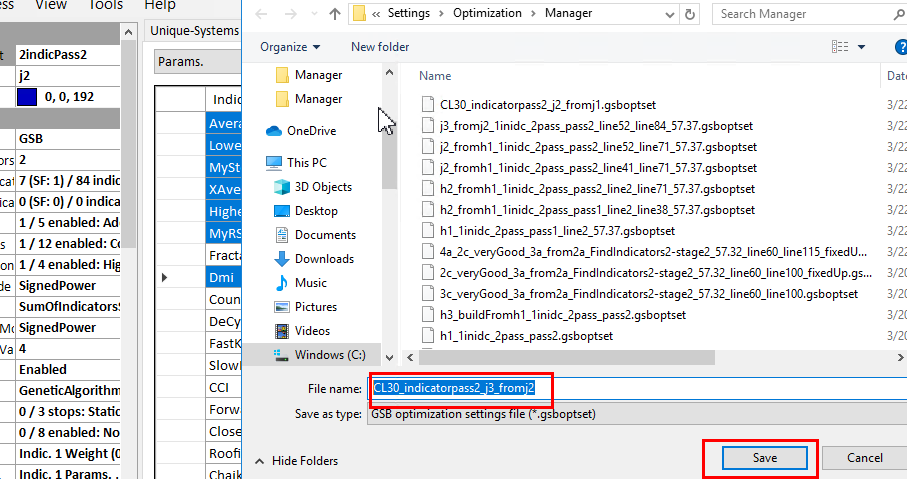
Save the app settings as CL30_indicatorpass2_j3_fromj2.
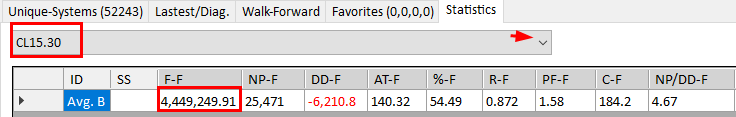
Step 4b. Optional. Get statistics of the out of sample indicators.
Note this figure has gone up from step3b from 3074 to 4449 step 3c. If your figures are much lower, or have not increased, something is wrong.
Step 5. Build systems with indicators from the second pass.
Open a new manager. (If you have low ram free, close the previous manager that was used)
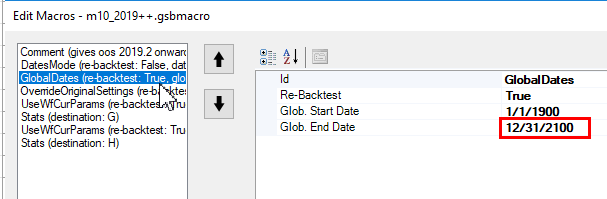
Either run the macro 16 (M4 group3) below if you have it (build 57.27 or later), or change the three settings in red.
Run macro16 (group3 m4) (GSB version 57.37 and above needed)
Save the optimization settings.
Close the manager and open a new manager. This should load the app settings as CL30_indicatorpass2_j3_fromj2.
We now build 50,000 systems.
The nth feature is not used in this case. I got better out of sample results NOT using it. This is a break for normal methodology.
The reason might be crude oil needs more data in sample to find the best settings. There would be about 130 trades to build the initial system on. (data pre 2015.6.30)
The number of trades this low is in self going to cause extra degradation. 260, trades is much heather.
Optional short cut method.
As a coarse test we omit doing the walk forward. This is going to save several hours CPU time.
At this point we normally run macro1, (group1) to walk forward the top 250 systems.
Macro 4 does this, but omits the walk forward. It also does the stats from 20190228 to the end of data.
Note that's 20191231 with the GSB supplied data.
The m4 is a new macro, so you may have to right click m4, to undo any old macro, and link the new m4 macro.
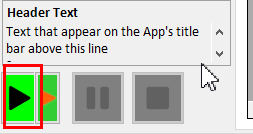
Note macro log wont appear until after you play a macro.
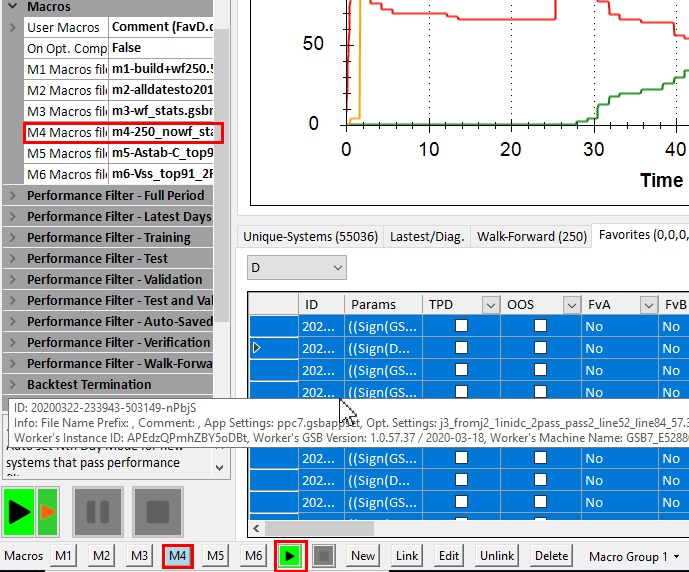
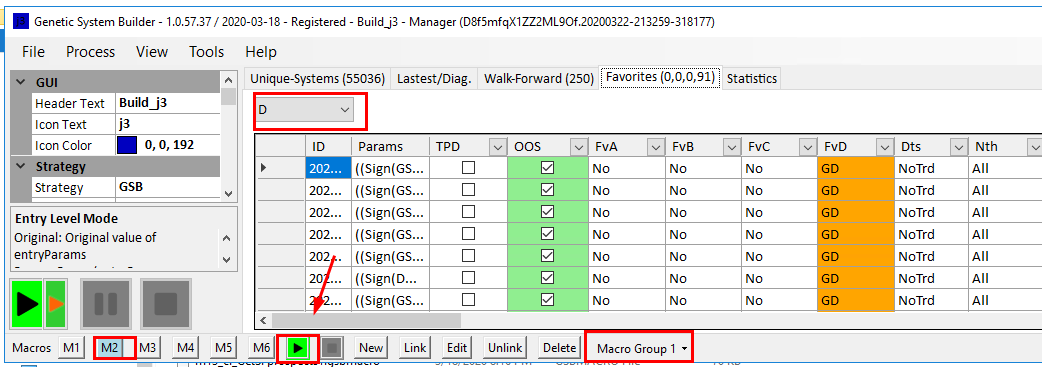
Favorites d now has 250 systems.
Run macro3 group1
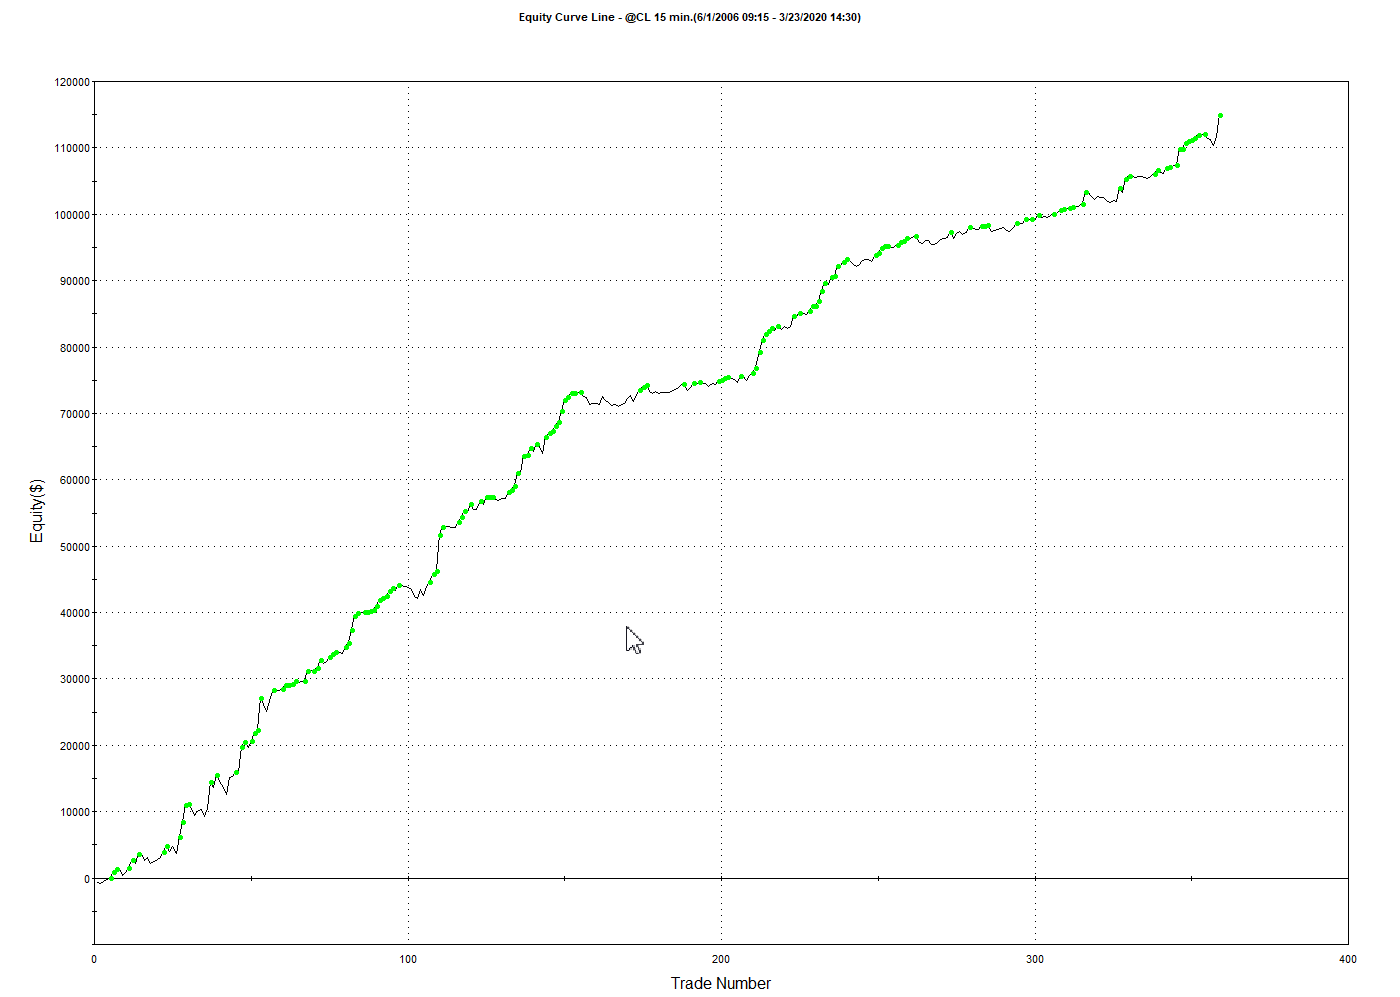
These results are good, so we want to see the walk forward results too.
If results are poor, something is wrong with your settings / technique. Stop here and recheck.
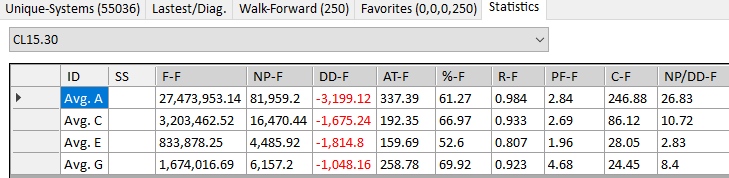
These results are great. If we had done a walk forward, the total of fitness C+D+E+F would be about 3203*2 + 833*2=8072.
This is actually a very good result. Note that the identical test setup will still give significant variation.
The math's used to derive 8072 assumes that the walk forward result gave the same fitness as none walk forward results.
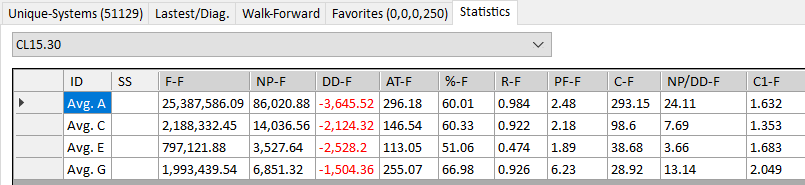
Below the results are much better than above, but it was the same test performed. Identical tests still
can give significant variation. Please look further below and you will see the same results with walk forward being completed.
A second identical test was done that choose slightly different indicators.
Results were roughly similar.
Undoing the short cut method, if the results were good.
This means we need to un-do the effects of the short cut step above.
Run macro2. (group1) This puts all dates of systems back to 2015. This is critical to do if you took the short cut step above.
It doesnt need to be done if the short cut step wasn't done.

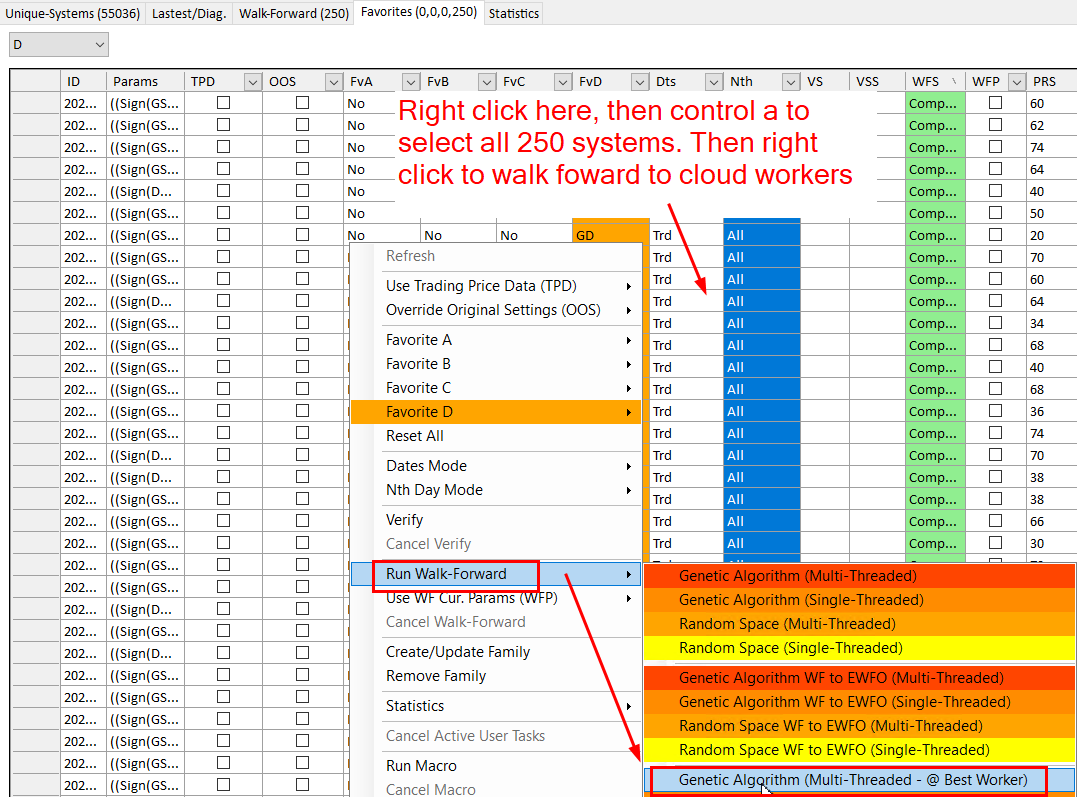
Walk forward the top 250 systems from favorites D once macro2 above has finished.
This would have been done in macro 1 Group1, but we stopped the macro.
This is done by going to favorites D, selecting all 250 systems (Control A) and walk forward to the cloud all 250 systems
Then run macro3 group1 to get the stats.
The section from first test & below assumes knowledge of the two links below.
The content in part C is similar to step3 here.
Results of market validation are here. Note I got significant differences on identical tests.
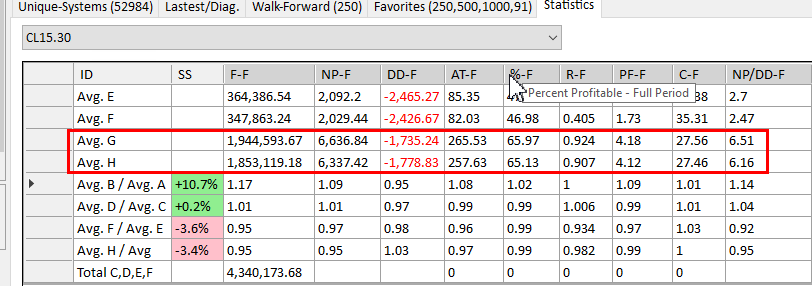
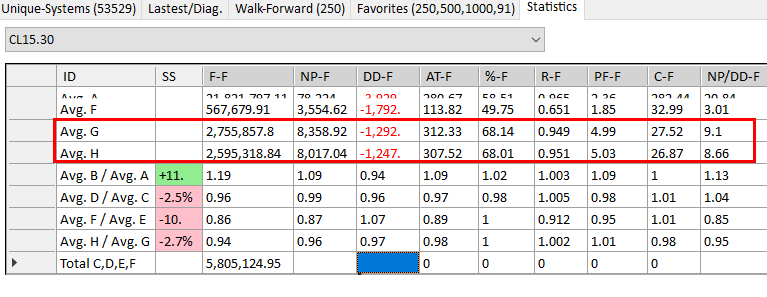
Note also I am included 20190328 to 20191231 results in ave G/H, but not in the total. (7814k)
The strength of this is you see more out of sample results, but its not truly out of sample as
if look at the results in G/H and act on what you see.
It leaves you only a small periods from 2020 for out of sample results.
First test top 250 systems
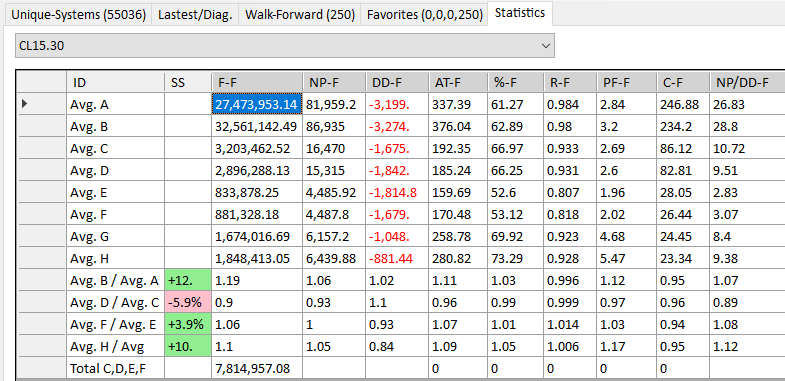
Note Avg G is the 20190228 to 20191231 non walk forward data,
Note Avg H is the 20190228 to 20191231 walk forward data,
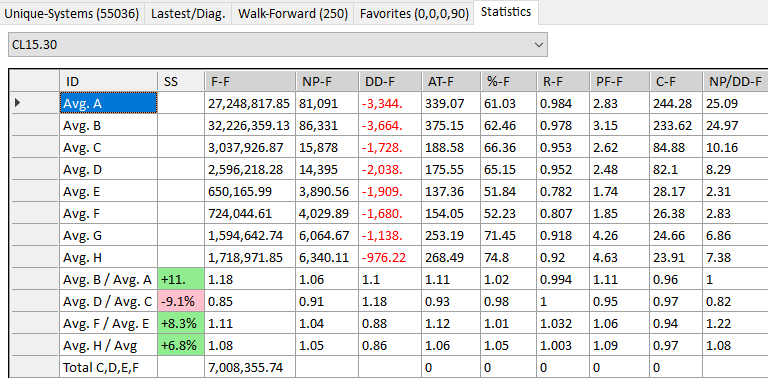
Results of the top 90 astab-c systems. (macro m5, group2)
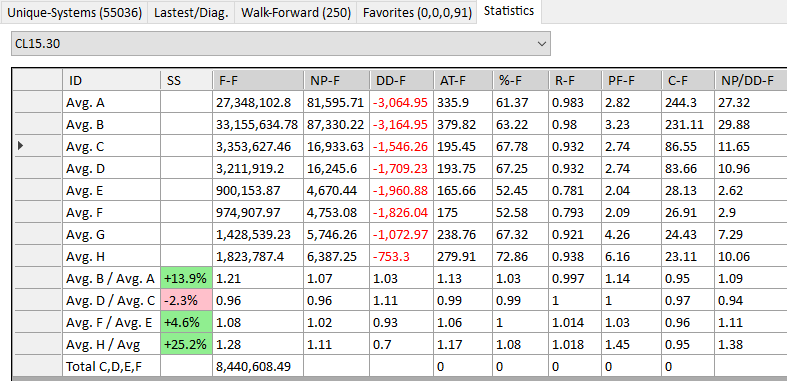
Results of the top 91 vss systems. (macro m6, group2)
To test the results of data from 2019 March 1 on-wards, run macro m4, group2.
Please note. Date in this test is done up to20191231. The macro used here uses are all dates in GSB.
Some revision of the M4 group 2 macro used till 20191231
Note, We are not using 2020 on-wards in these tests, but 2020 had 2 days that stopped many systems, and then some big wins which some systems caught.
Other points to note. The new indicator methodology has indirectly introduced a great deal of stress testing, and I dont see the need to build systems on 14,15,16 minute data.
I do note that my results showed top asab-c scores don't help crude oil systems.
On S&P 500 the same testing of random data and doing walk forward gave much better results
How to chose a system to trade.
Select whatever systems gave the highest stats from the top 250, or top astab-c 90, or top vss 91
In this example I am using the top 91 vss scores that are in favorites D after running macro 6 group2
Run macro2, group 1 to put the dates back to 20150630
Create a family.
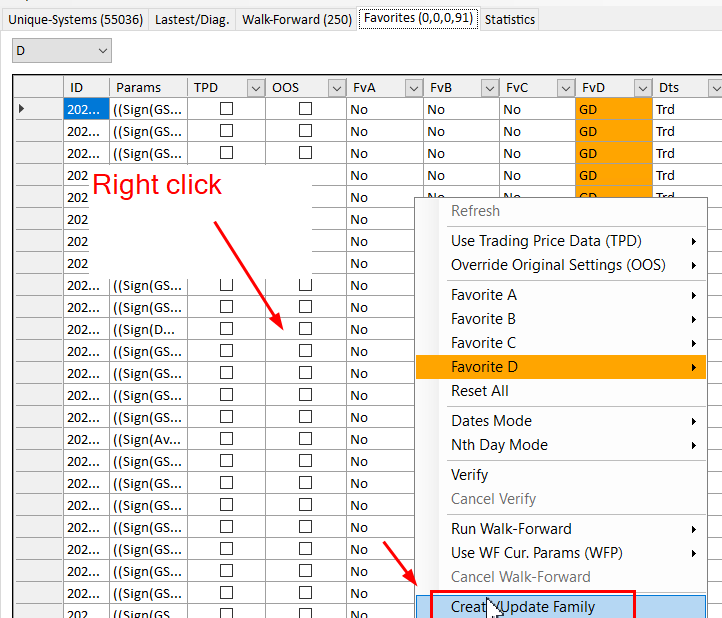
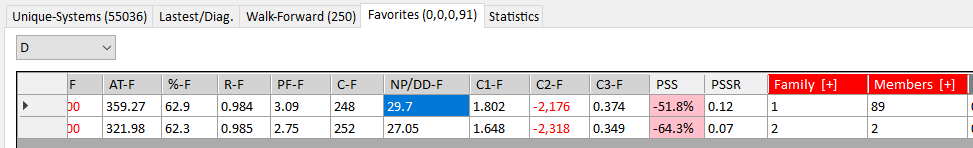
Below we have only 2 families in the top 91 systems (unusual)
Chose one of the top systems in each family as possible systems to trade.
You can optionally do a walk forward to EWFO for more analysis. This will be covered in months to come.
We can see the the first system occurred in 89 of 91 systems. This implies it is likely to be strong and robust regardless of precise parameters.
Not shown, check the results match from GSB to TS/MC/NT
System added onto Tradestation chart with $4.80 brokerage and $20 slippage.
Out of sample results shown.
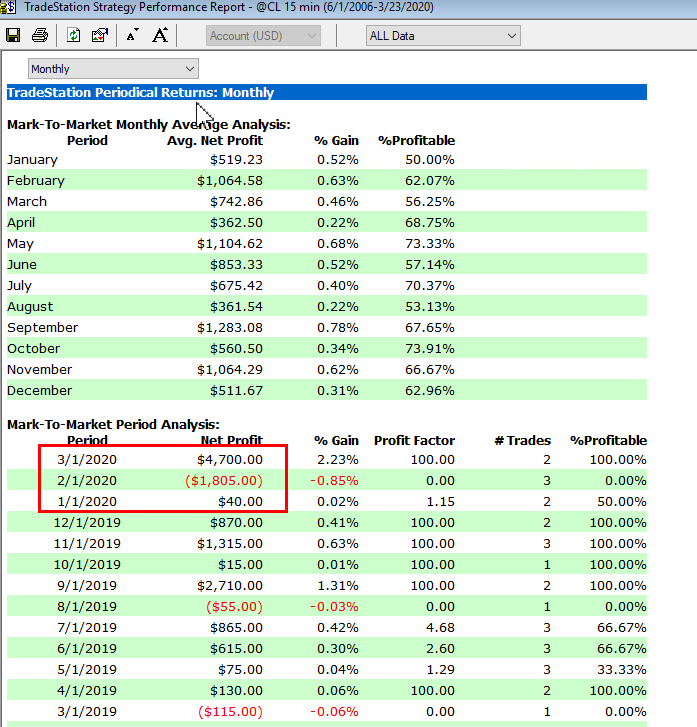
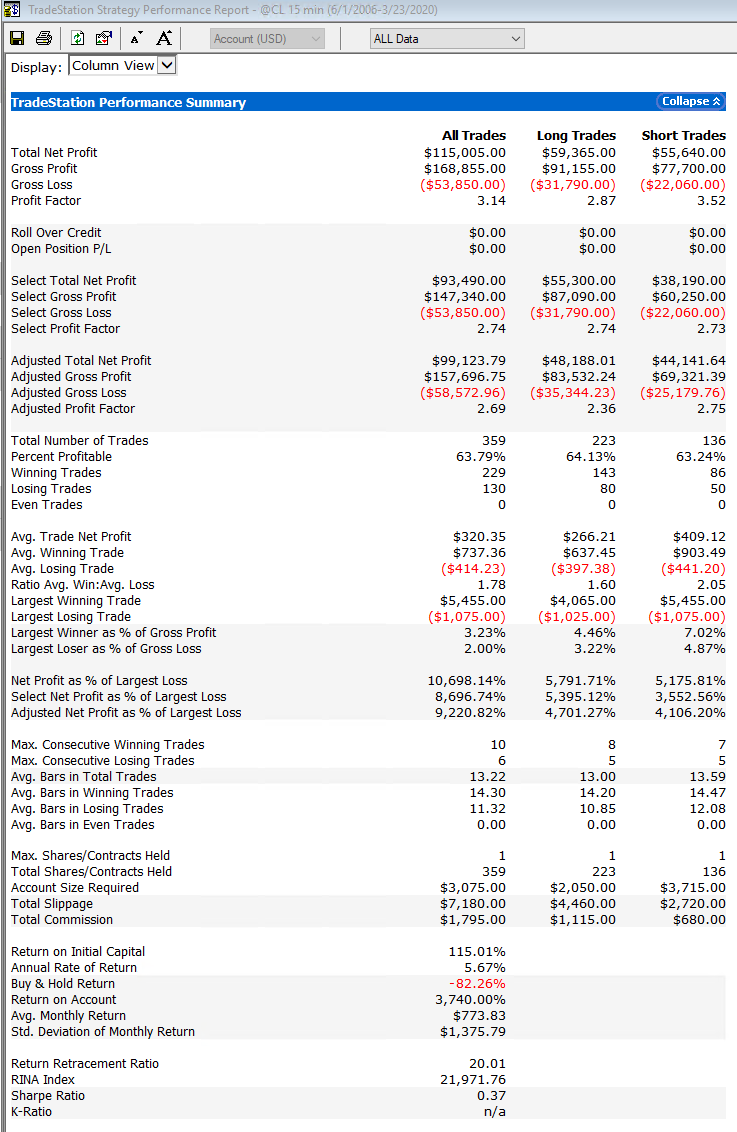
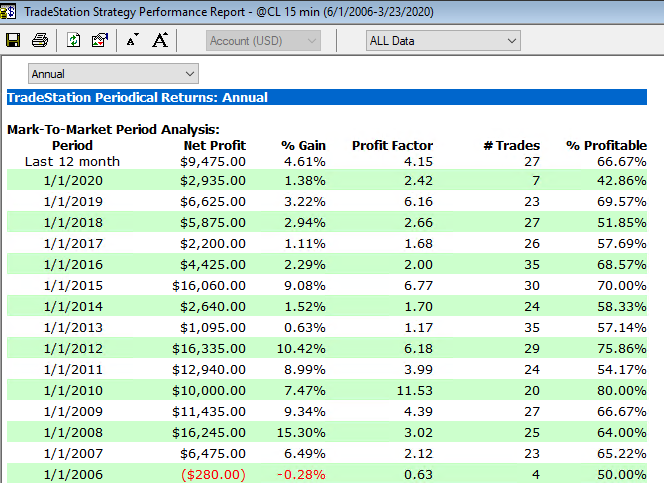
First test. Results 20190301 to 20191231. These are really good out of sample results
Second test. Results 20190301 to 20191231. These are much better good out of sample results.
no slippage and commission has been used in these tests, but results in out of sample periods were excellent.
Part of this is great market conditions. 2019+ was much easier than 2015 to 2018 to trade crude oil.
To go from here to getting a system for live trading, go to PartE.