Walk-Forward Testing
See this video for more information. https://www.youtube.com/watch?v=CQy-yP_kBMM
Walk-forward testing is a trading system design and validation technique in which you optimize the parameter values on a past segment of market data (in-sample) and then verify the performance of the system by testing it forward in time in data following the optimization segment (out-of-sample). The system evaluates how well the system performs on the out-of-sample data. This is repeated over a number of subsequent time periods. In the case of GSB the data is divided into 10 segments.
A diagram shows the procedure in the diagram in FIG 1.71. The diagram shows 10 overlapping segments of data. The cyan data is used to optimise system parameters which are then tested on the blue segment and this is repeated 10 times. The concept is further explained in the two diagrams FIG 1.72 and 1.73 below.
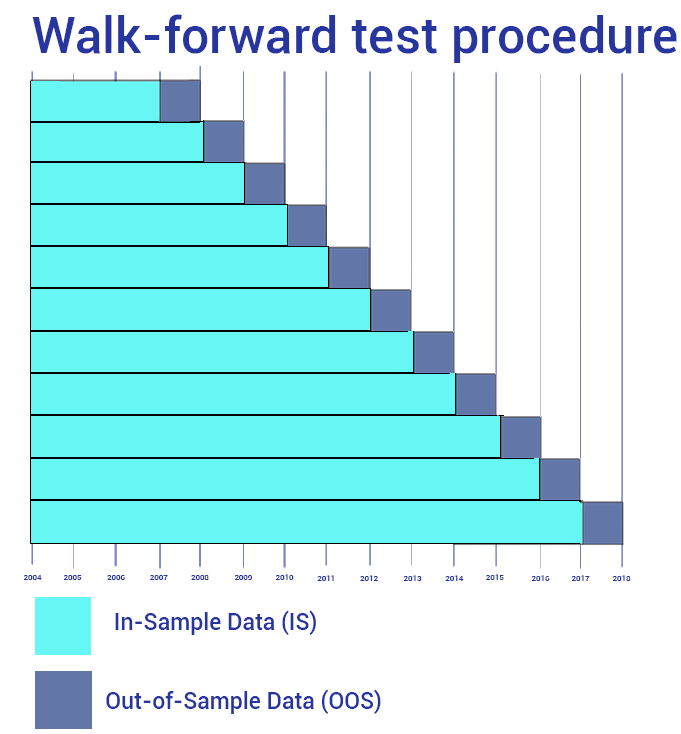
FIG 1.71 Walk-Forward Test Procedure
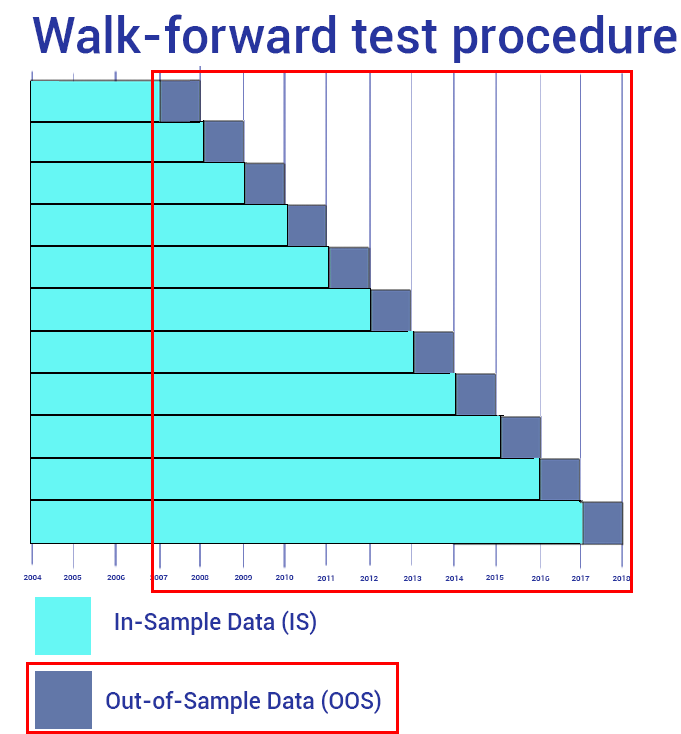
FIG 1.72 Optimization at last WF run. The area in blue is now our out of sample period. In GSB this is called WF OOS, though it as added to the first run of in sample data.
The Opt Best Training is the curve which is a result of the initial system parameters.
The WF current is the final curve with as parameters which work best over the entire period. We use this for live trading.
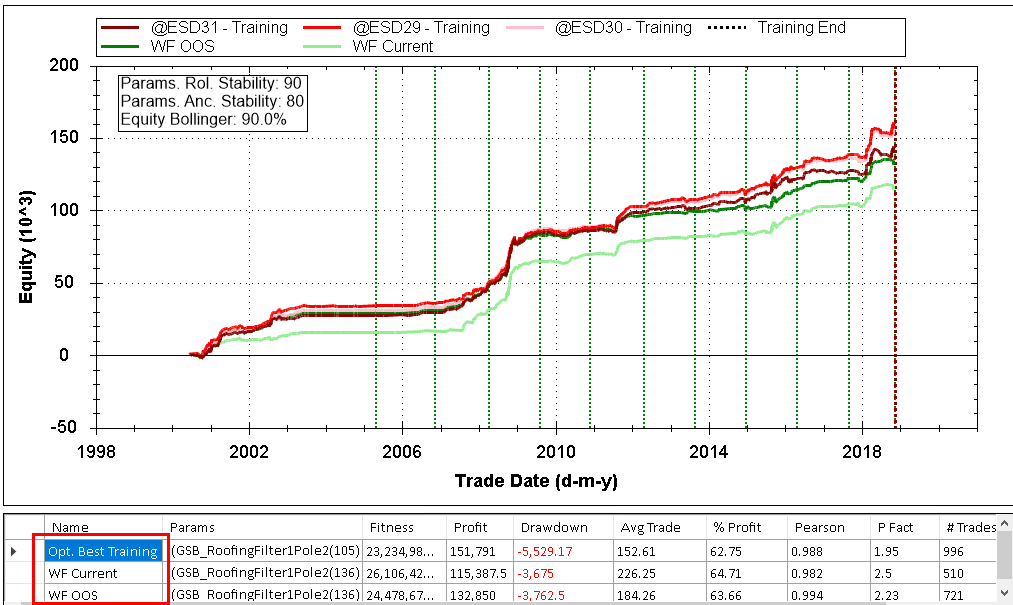

FIG 1.73 A GSB WF output.
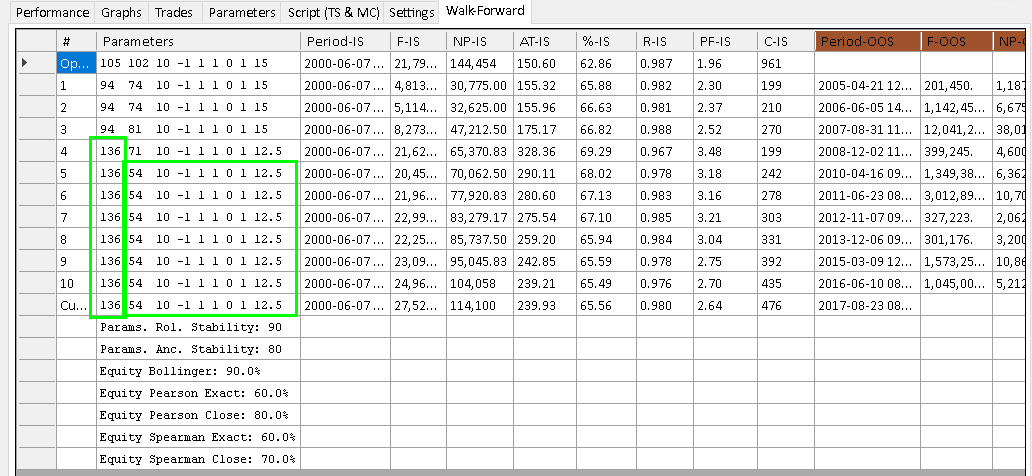
FIG 1.74 A GSB WF output.
We like the parameters to be stable. This implies its clear they are the best, and likely robust. The higher the better, but anchored stability score above 40 is best
We will now run a walk-forward optimization for the AAPL systems we identified earlier. The setup for walk-forward testing is shown in FIG 1.74. We have kept the defaults which do 120*120 (144K) iterations but have changed the Nearest to 60 which (highlighted).
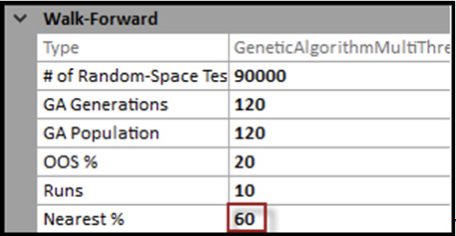
FIG 1.74 Walk-Forward Setup
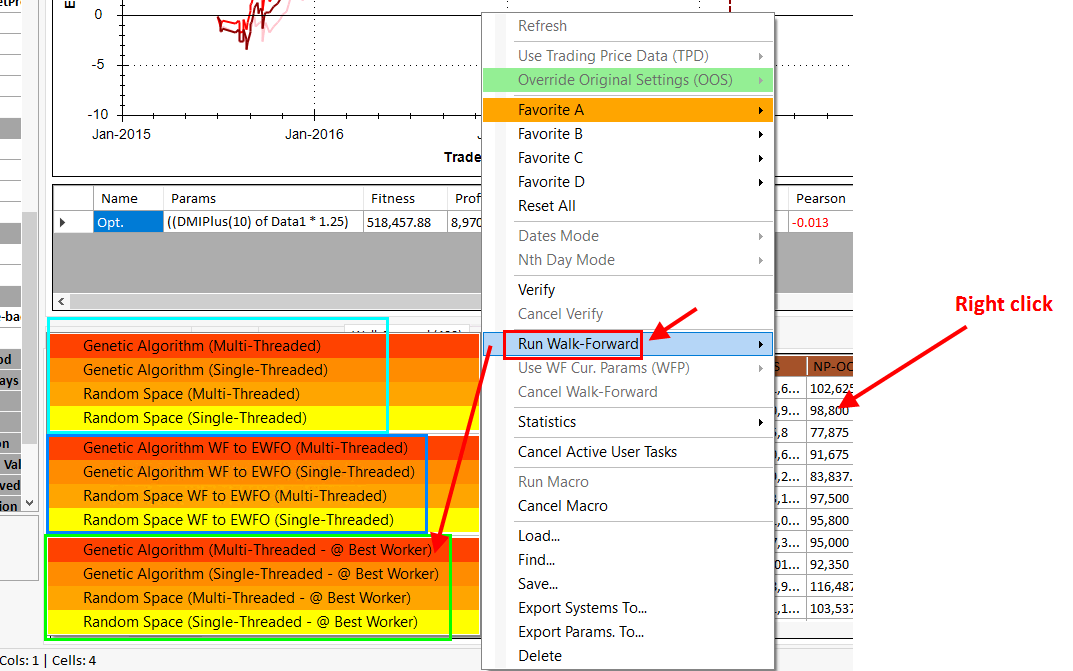
Walk-forward testing is done by right clicking on our chosen system highlighted in FIG 1..75 and selecting Walk Forward – Genetic Algorithm (Multi-Threaded). To use Multi-Threaded you will probably need 16Gb of RAM.
You can also send WF jobs to the GSB cloud & or your own workers. (recommended)
See also this link on walk forward for EWFO & Tradestation WFO
FIG 1.75 Running Walk-Forward
When the walk forward optimization has been completed the output in the chart area shows the results as depicted in FIG 1.76.
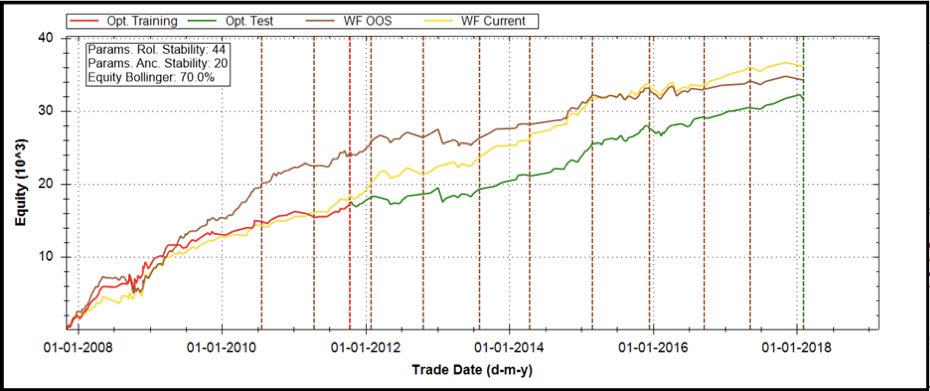
 FIG 1.76 Results of Walk Forward Testing on System 1
We are looking for walk-forward results to show the out-of-sample (OOS) equity curve (the brown line) to be above the original curve (red and green lines), be as linear as possible and have the profit factor and average trade size to be as good or better. In our walk-forward test the OOS curve is not as linear as the original test, trade size is smaller but profit factor and net profit higher. We expect that futures real time trading would deliver results more like the brown line than the original red/green line. We can conclude that this is quite a good result.
Let’s look at the results for system 2. The equity curve for system 2 is shown in FIG 1.77. This again looks good with a straighter equity curve overall than for system 1. We now run a walk-forward test on this system and the results are shown in FIG 1.78.
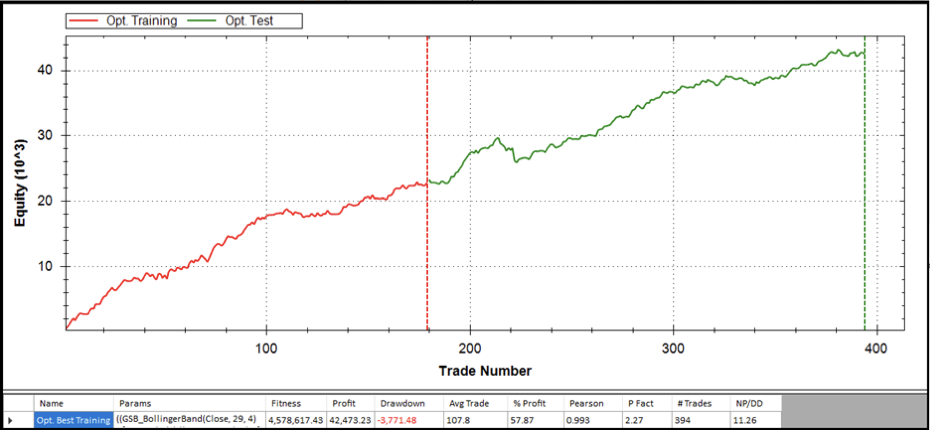 FIG 1.77 Equity Curve for System 2
With this system the brown OOS curve is very close to the original curve although it falls below slightly at the end. In our walk-forward test on system 2 the OOS curve is just as linear as the original test, trade size is larger, profit factor and net profit are higher with average profit slightly lower. This is quite a good result and maybe a little better than system 1. We actually originally went with system 1 so we will now copy and paste the original MultiCharts code for system 1 into MultiCharts.
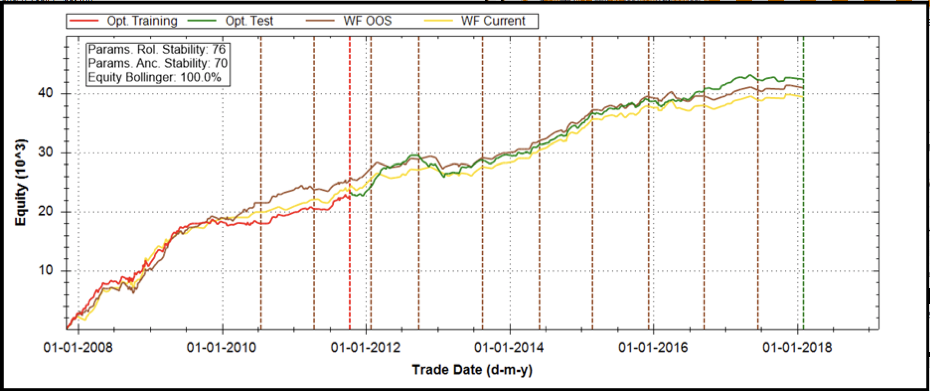
 FIG 1.78 Results of Walk Forward Testing on System 1