GSB Benchmark
Very significant speed increases can be made by optimizing to your unique hardware.
As the number of CPU cores, speed of the core, memory and most importantly how much ram a computer has - GSB can be bench-marked to maximize performance.
We are using standalone GSB to emulate the speed of GSB workers. Tests are always identical as the random seed in GSB is changed to be pseudo random.
To get maximum speed in hardware, things get really expensive the higher CPU you go, and somewhat also with ram.
You can maximize your investment in hardware with GSB benchmark.
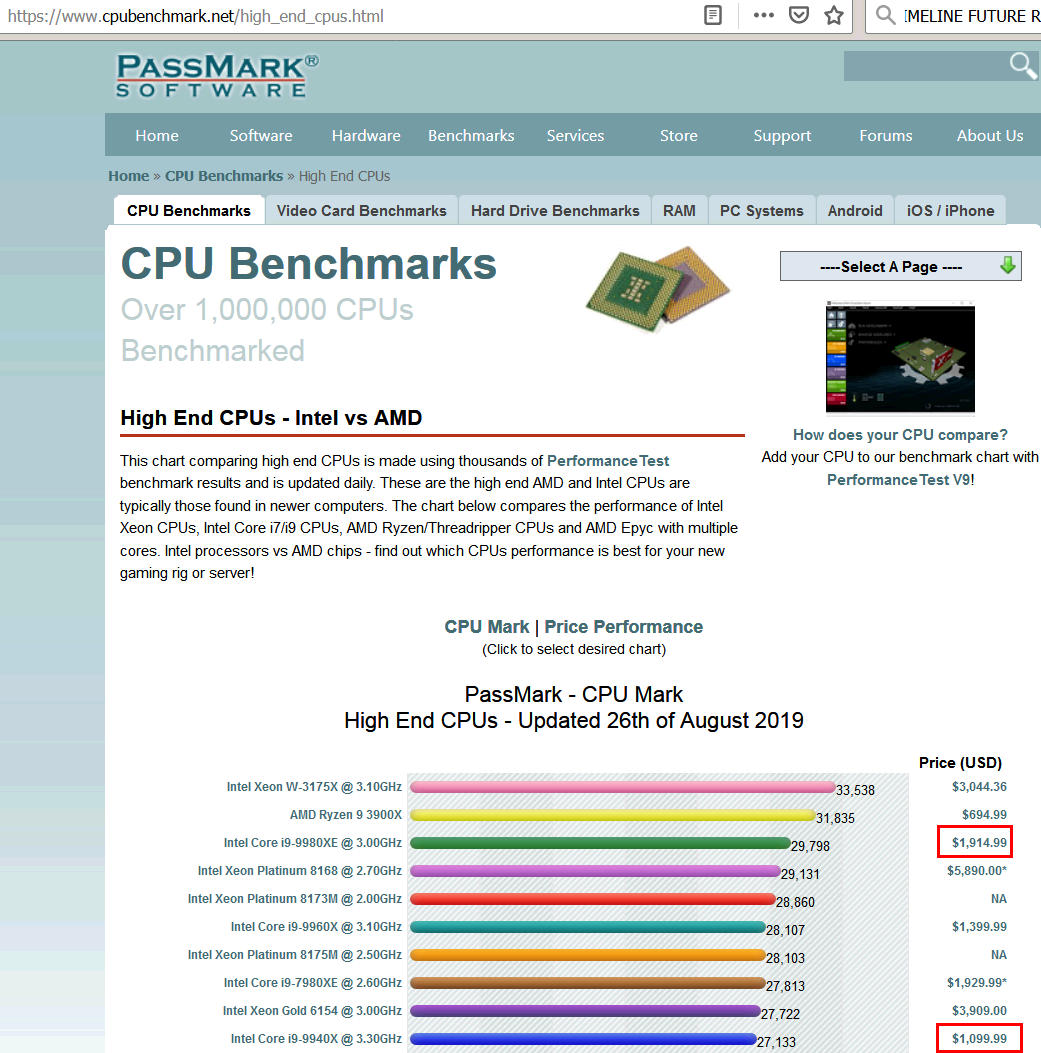
Below shows that for a 10% speed increase by getting a faster CPU, the cost was $900
WIth GSB Benchmark, similar or greater increases can be obtained with the main cost being your time to run some tests. With purchased GSB benchmark a library of existing machines results will be provided. Short term this will be the I9, I7, single CPU high end Xeon, dual CPU Xeon E5-2690 V2
Part 1, maximize performance of building systems.
Ultimately what can be tweaked is the amount of workers that you run on a machine. All workers combine results to go to the manager.
The second thing that can be tweaked is memory usage. More memory gives more speed, but you must stay within the limits of your hardware.
GSB Benchmark will not allow you to use more than its estimate of your ram usage.
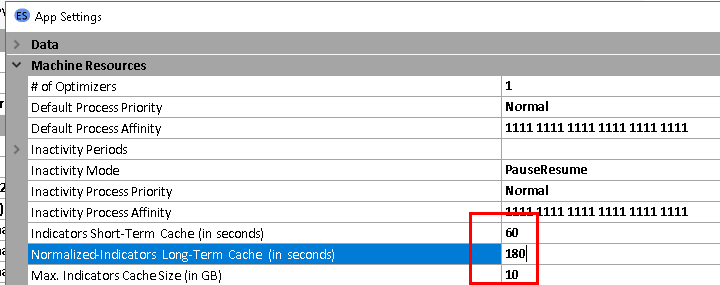
Going to high cache settings gives about 10% more speed than default cache settings. If your low on ram, you can tweak cache down at the expense of speed.
Standard cache settings are 60 180 10
Large cache 600 1800 20
Small cache 30 90 1
Part2, maximize the performance of walk-forwards.
What we have control of is how many walk-forwards a worker can do at one time, and if the walk forward is multi threaded, or single threaded.
Singled threaded WF are much slower, but much more ram efficient and lower CPU usage. 20 concurrent WF took 23 minutes on our benchmark, with 7.3 GB of ram usage.
The same test with 16 WF done with 8 workers doing 2 WF at once tool 28GB of ram, but 9 minutes
The WF population / generation for benchmark tests is 1- generation, 50 populations. The default WF is 120 generations, 120 population. So the test is 28.8 times faster than a normal WF
Shown below is a benchmark on a I9-7920x with 96 GB of ram
There are 2 WF for every GSB launched. This is set in the macro file 2WF
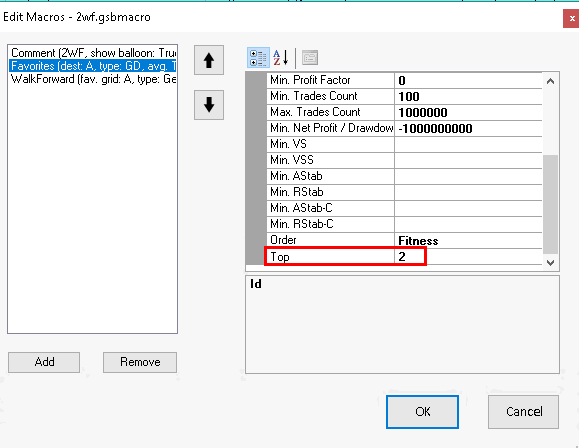
Shown below we are running 1 WF per every GSB launched. This value can be experimented with.
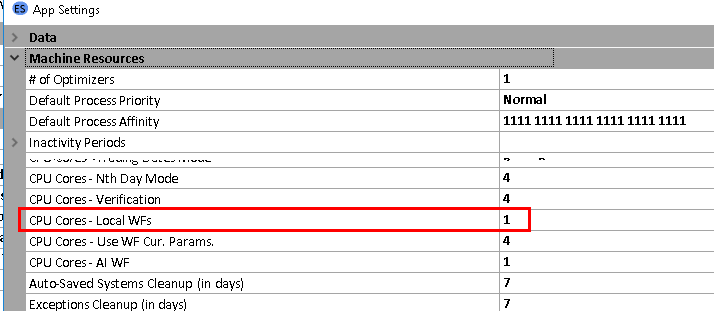
So if you were running 4 WF at once per GSB, then local WF should be set to 4 and the macro above set to 4.
This means each GSB will load 4 systems and WF 4 at one time.
In Benchmark 20180828.2, the amount of systems that are WF is read by the benchmark program from the macro command.
So if 5 systems are WF, the elapsed time will be divided by 5 to give the average time per WF>
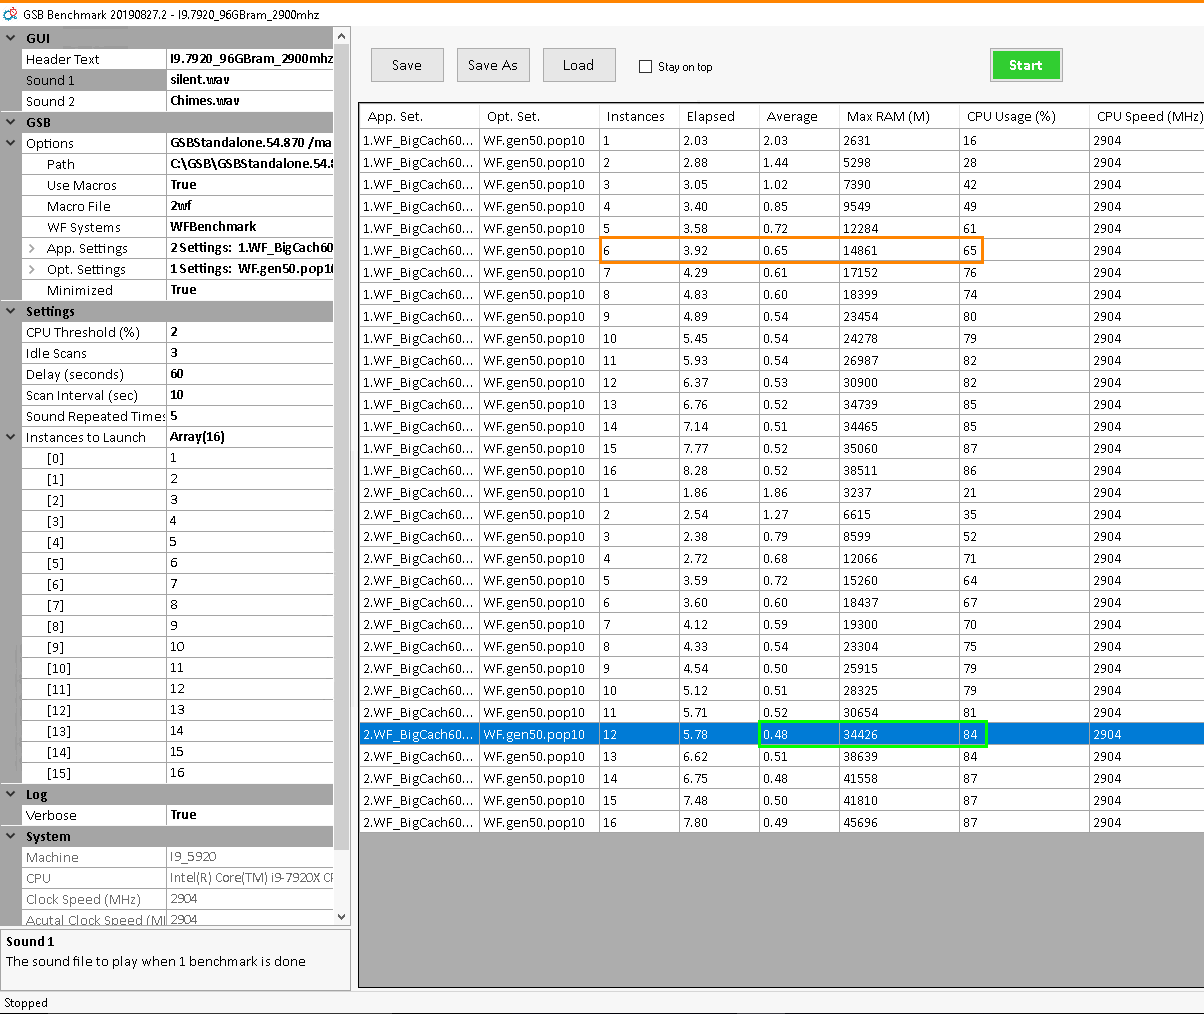
The above test shows that 12 GSB running 2 WF each gave the fastest WF speed of 0.48 minutes if you have 34.4 GB ram on your machine.
If you had only 16 GB, then instant 6 of .65 minutes is going to be fastest.
Description of Benchmark fields.
Header. User comment that appears at the top of the app.
Sound1, Plays after each test is done.
Sound2 Plays after entire test is done
Options, Auto filled by Benchmark
Path, Path of the standalone. Must be version 54.78 or higher
Use macros. Must be true for WF tests. Must be false for system building tests.
WF systems. Path of the systems used to WF. 10 systems are supplied with GSB Benchmark
App settings. Multiple can be selected. This is where the cache and number of WF allowed at one time is set,
Opt settings. Multiple can be selected. This is where the population / generations of WF are set. (plus what symbols you trade etc)
Minimized. Minimize workers when they run
Settings
CPU threshold (%) When CPU drops below this figure for 3 idle scans 10 seconds apart, then workers are considered to have been finished.
Sound repeat times. Sound files are played this many times.
Instances to launch. In the example we start with 1 GSB launched, then increase to 16 GSB launched at one time. Do not do more than your ram allows.
Log. True if you need to diagnose any faults in Benchmark
System. Populated to GSB Benchmark for your reference.
Results
App set shows the app settings used
Opt set shows the opt settings used
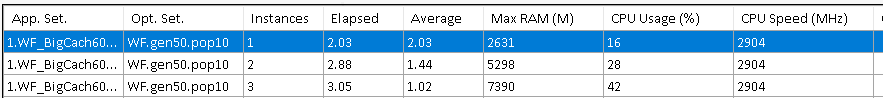
Instances shows how many GSB were running
Elapsed is the time in minutes the test too to complete.
Average is elapsed time / instances. So 2 GSB tool 2.88 minutes compared to 1 GSB of 2.02 minutes. However 2 WF were completed in the second test to the average WF time was 1.44 minutes compared to 2.03 minutes for 1 GSB
Max ram is the total peak ram used by all the instances of GSB launched,
CPU usage is the average CPU usage launched by the test.
Bottom status bar
This shows status of running or stopped.
If status is running we can see the current number of instances, ram used, CPU % and elapsed time for the specific instant we are on.
Important tips
Before you run Benchmark, ideally reboot the PC, close down all apps that use the CPU. For example dropbox, GSB resource monitor, all copies of GSB.
This is so GSB gets full CPU and ram usage.
