Folder: “Graphs” – Performance Matrix
The performance matrix looks like this:
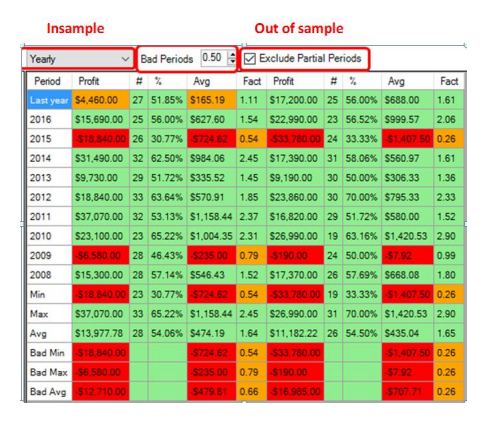
The performance matrix shows the following information about the walk-forward equity:
- Period: This is either one year or one month, depending on the parameter selection. There are also periods of Min (with the worst results), Max (with the best results), Avg (with Average results). “Bad Min” shows the worst of all negative periods, “Bad Max” shows the smallest of the negative periods and “Bad Avg” shows the average of all drawdown periods.
- Profit: is the net-profit per period.
- #: shows the number of total trades per period.
- “%”: this shows the number of percent winning trades per period.
- “Avg”: this shows the average profit per trade and per period.
- Fact: This is the profit factor per period.
Options for the performance matrix:
- Period length: There is a pull-down menu where either “Yearly” or “Monthly” can be selected.
- Bad Periods: (Min,Max,average) This is the results of the bad years that are 50% or worse the average of the other years.
- Exclude Partial Periods: With this option selected Periods which were not fully traded will not be shown. If this is not selected all periods with be shown.