Folder: “Graphs” – Equity curves
The equity curves show this:
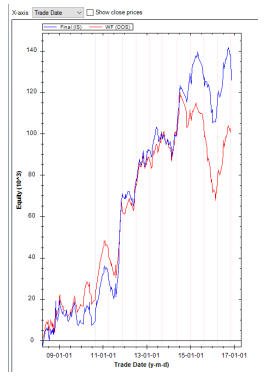
- Final (IS) curve in blue: see “Optimization Summary (IS)” run=Final. This equity curve is built based on the parameter settings in run=Final over the entire IS period.
- WF (OOS) in red: this equity curve is built adding up all OOS runs (see Folder: “Walk-Forward Summary (OOS).
Options for the equity curves:
- X-axis: On this pull-down menu either “Trade Date” (as per above example) or Trade Number can be selected.
- “Show close prices” can be ticked. This will introduce a third equity curve with the close prices for the instrument being traded. In the above example this is un-ticked.