Folder: “Graphs” – Statistics
The Statistics look like this:
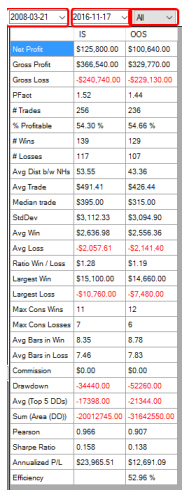
These are the statistics for the In Sample (IS) and Out of Sample (OOS) trades within the chosen settings.
Options for the statistics:
- Dates: there are 2 dates (from-date and to-date) which can be changed. The statistics shown will be statistic numbers within the chosen dates.
- Type of trades: This can be “All” or “Long” or “Short” – The statistics shown will be statistic numbers for either “All” trades, “Long” trades only or “Short” trades only.