Exporting data from Ninja Trader to GSB
Exporting Data from NT8 for GSB System Building
This guide applies to NinjaTrader version 8.0.19.1 64-bit
Differences in price data from different trading platforms
Price data from different sources will be slightly different, even for the same market, timeframe and chart type. As a result, if you mix different data sources you may get different results than you expect.
So as a general rule, build GSB systems on data from the system you intend to trade on.
For example, if you started using GSB with Tradestation data, such as the example data provided with GSB, the systems that were built had particular performance attributes. If you took those systems and back tested them on NinjaTrader, the results will most likely be different from GSB. The reason for this, is that, even for the same bar at the same time of day the O,H,L,C and volume data can be different.
The figure below shows the variations in OHLC data between Tradesation and NinjaTrader Continuum data for 30 min bars over a period of time.
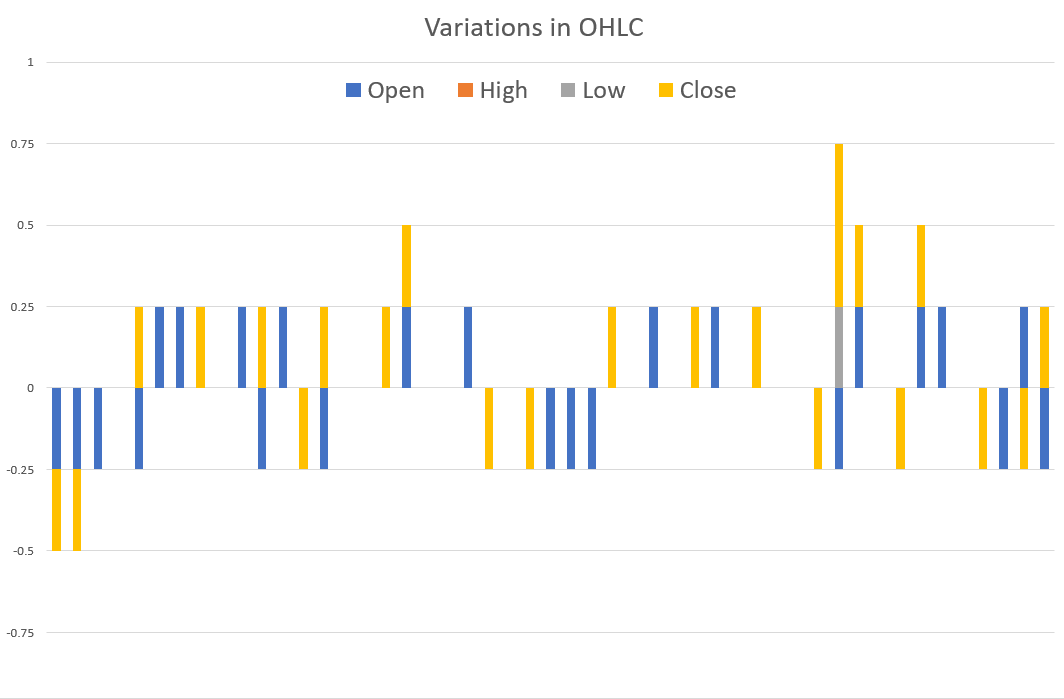
The variation may not look like much, but it can be sufficient to lead to differences in which trades are taken and which are not and the price at when a trade is entered and exited.
Exporting Data from NT8
If you intend to trade GSB systems in NinjaTrader the process you should take is to:
- Configure NinjaTrader options correctly for use with GSB and import the GSB AddOn into NinjaTrader (see separate guide)
- Export Data from NinjaTrader and put it into your GSB Price Data folder (this guide)
- Build GSB systems (see GSB help and videos for methodology)
- Import GSB systems into NinjaTrader (see separate guide)
When you import the GSB AddOn to NinjaTrader, it also imports the GSB Price Data Exporter indicator, which, when added to a chart, saves the price data on that chart to a file. This guide describe how to export data using the GSB Price Data Exporter. You may also use the built in NinjaTrader data exporter. See NinjaTrader help for details.
In order to use the GSB Price Data Exporter, you must have first imported the GSB AddOn to NinjaTrader.
Step 1. Set up a new chart
If you already have a chart set up that you want to use, then you can skip to the next step.
Open a NinjaTrader chart. From the Control Center, select New > Chart

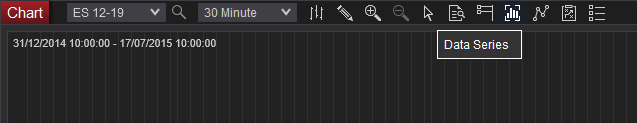
On the chart in the top menu bar click on Data Series icon.
Add the correct data series to match the data that you built your GSB systems in, noting the Data Series (Type and Value) and Time frame.
Under Time frame select Custom Range then match Start Date, End Date and Trading Hours (ie session template) to your GSB data series. Note that the price data on your chart may not go as far back as the start date you set, depending on your data provider.
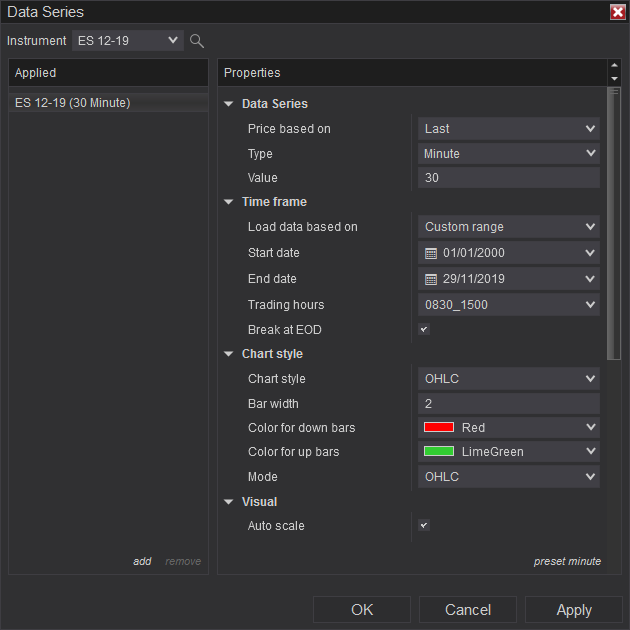
Left click OK and wait for the chart to load.
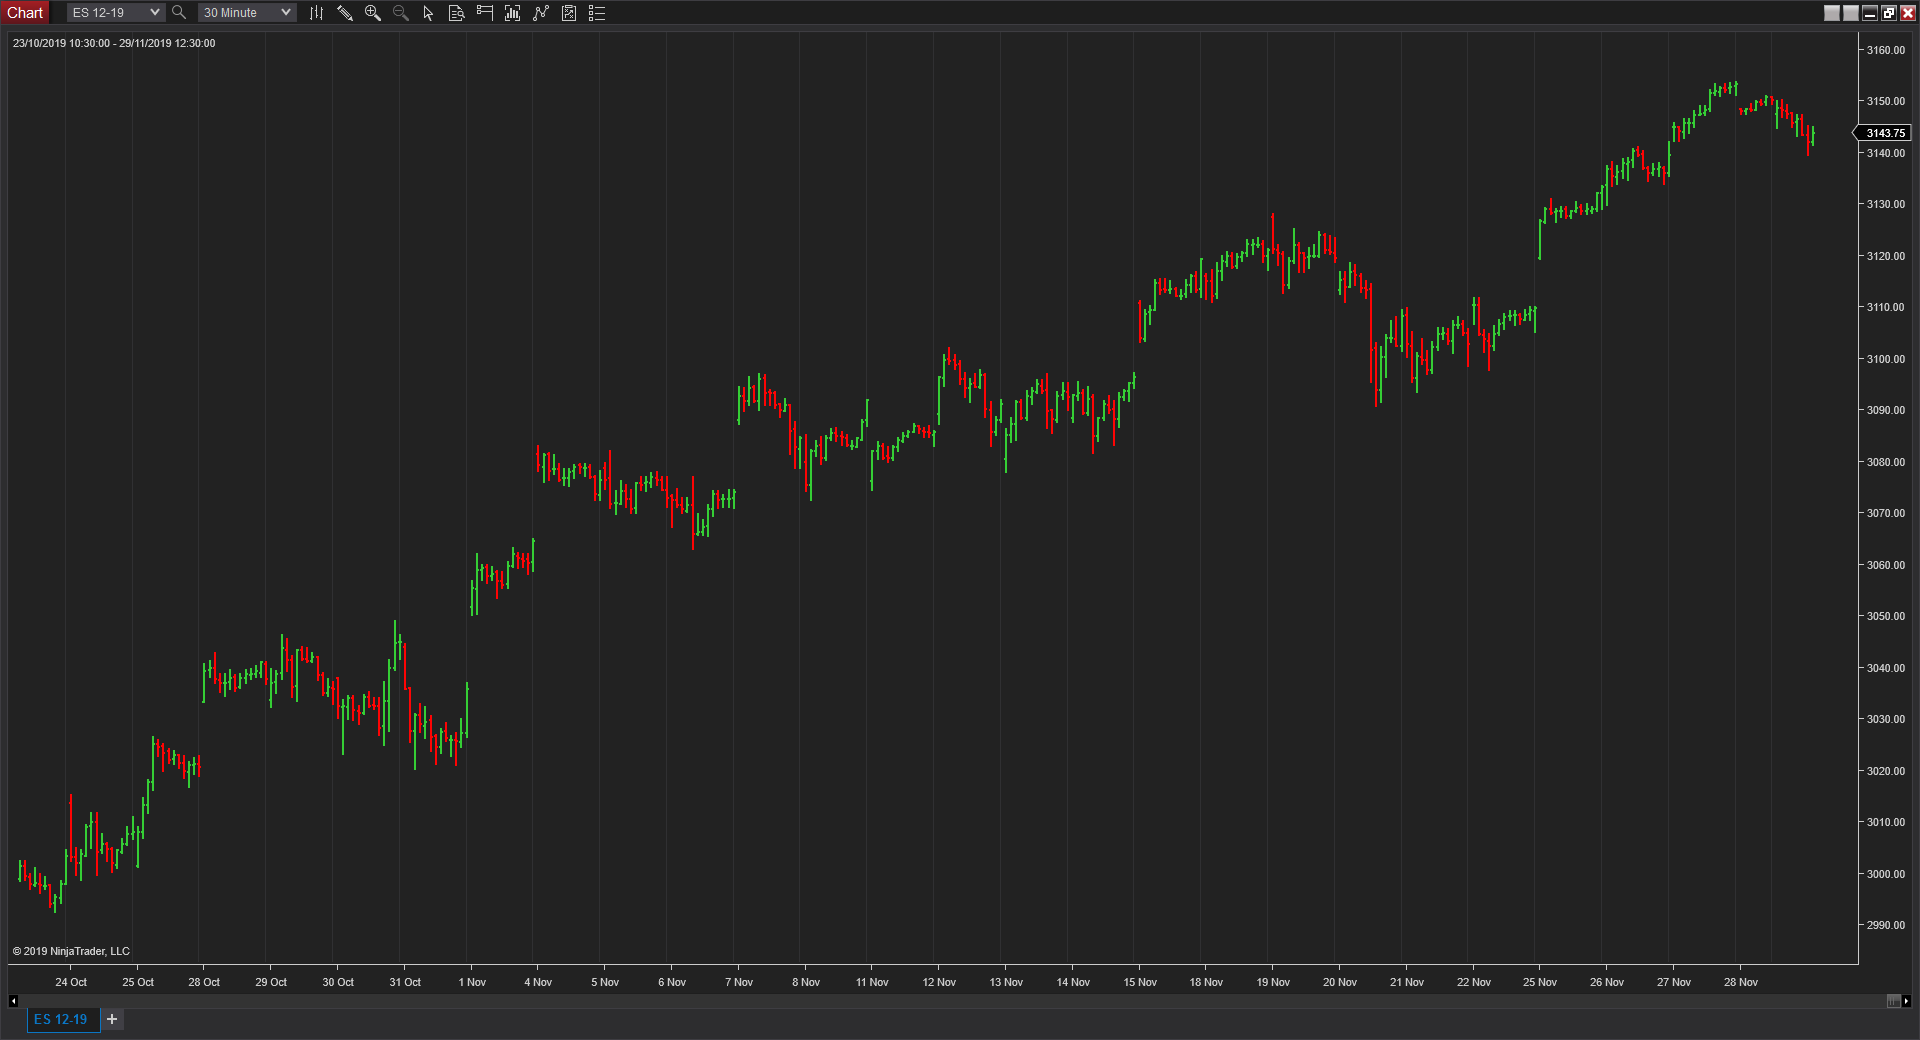
It is a good time now to scroll left to the beginning of your data to see how far it goes back
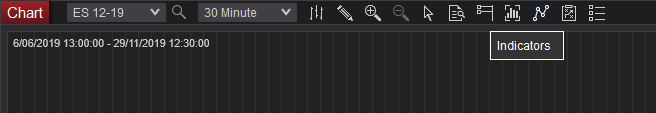
The data range that is currently displayed on the chart is shown it the top left corner of the chart.
If that does not appear for you it can be added as follows.
Left click on the Properties icon on the top menu bar of the chart.

Under General > Font left click on Show date range to tick the check box.
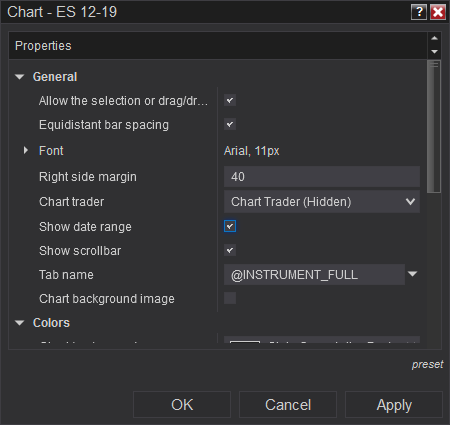
Click OK
The date range that is visible on the chart (not for the whole price data series) will appear on the top left corner of the chart.
Scroll to the very left of your chart, noting how the date and time values change as you scroll, to see the date and time your data commences. If you scroll back to the very right again you will see when it ends. When you export your data, you may like to include these start and finish dates in your price data file name.

Step 2. Add the price export indicator to the chart
When you add the indicator to the chart it runs a script which exports the data to a text file.
With the chart that you have now loaded with the full date range and type of bar and Trading Hours (session template) applied, add the indicator.
From the menu at the top of the chat, left click the Indicators icon.
In the top left Available window, scroll down until you find GSB Price Data Exporter.
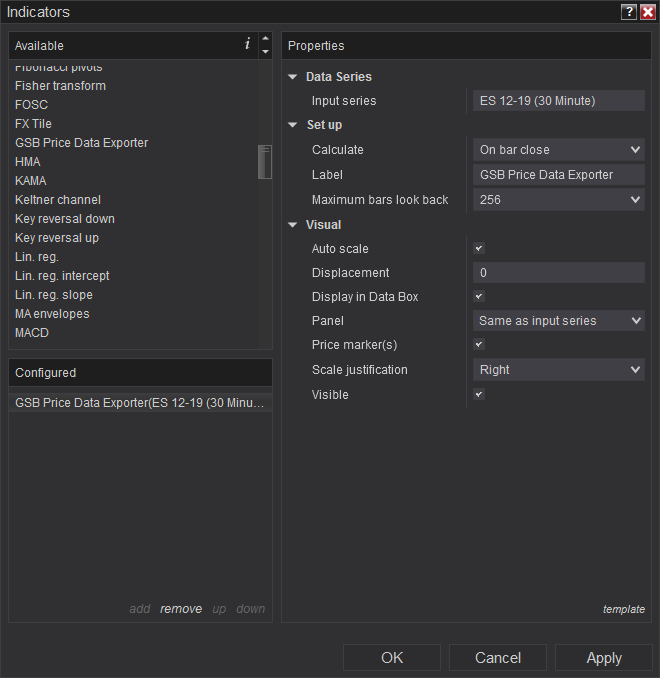
In the bottom of the Configured window, left click add.
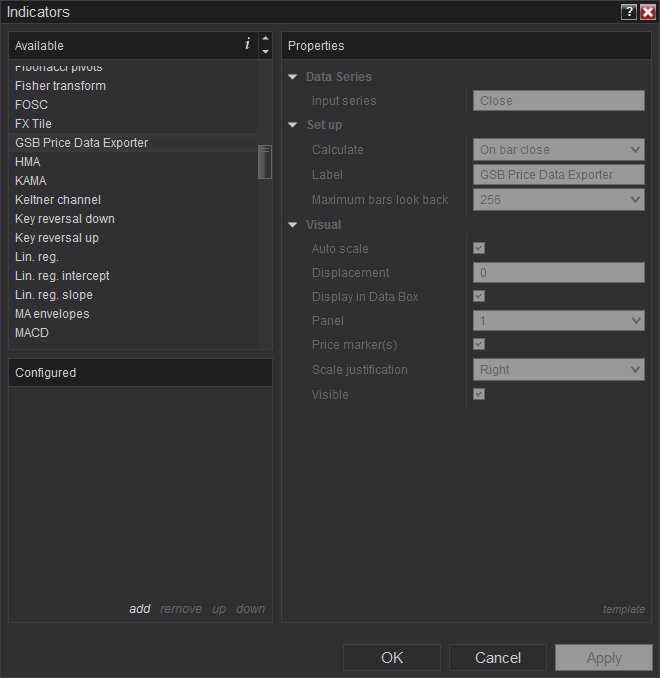
The indicator will appear in the Configured window and the configuration settings on the right hind side in Properties will activate.
Do not change any of these settings.
Click OK.
The indicator will be loaded onto the chart which opens the following Save As dialog box.
Use the explorer pane to navigate to your GSB Price Data folder.
Select a file name using the convention describe here: https://trademaid.info/gsbhelp/Data.html
The file name format needs to be
{The Contract or Symbol name}.{The time frame}.{The bar type}.{any other data you like}.txt
For example:
ES.30.Minute.0830-1500CentralTime_1May2006-29Nov2019.txt
Click Save.
The data file is ready to be used in GSB.

The indicator may now be removed from the chart.
To export data again using a different contract, date range or Trading hours, follow the steps above to add the indicator again and save a new Price Data file.