Cluster analysis
- The points below is a guide how to use cluster analysis. There is lots of scope for users to use EWFO differently.
- non of the WF profit should contribute > 50% to the total profit
- non of the WF loses should contribute > 25% to the total loss
- 8 runs out 10 should be profitable
- Walk Forward Efficiency should be > 60
- OOS trades >= 80% IS trades (number of trades and AVG trade)
- for successful matrix:
- A minimum of 8 cells close to the center to have successful WF cells (above). the more successful cells the more robust is the strategy. then you can categorize strategies based on a number of successful cells, like 8,15,20,25. Obviously, 25 cell strategy should have the priority to be funded before 8 cell strategy.
It is likely you will get some lucky runs regardless of filters, that's why cluster analysis is important
Run 25 WFA and look for at least 7 successful runs in the middle spreading outwards to accept the strategy as a robust one.
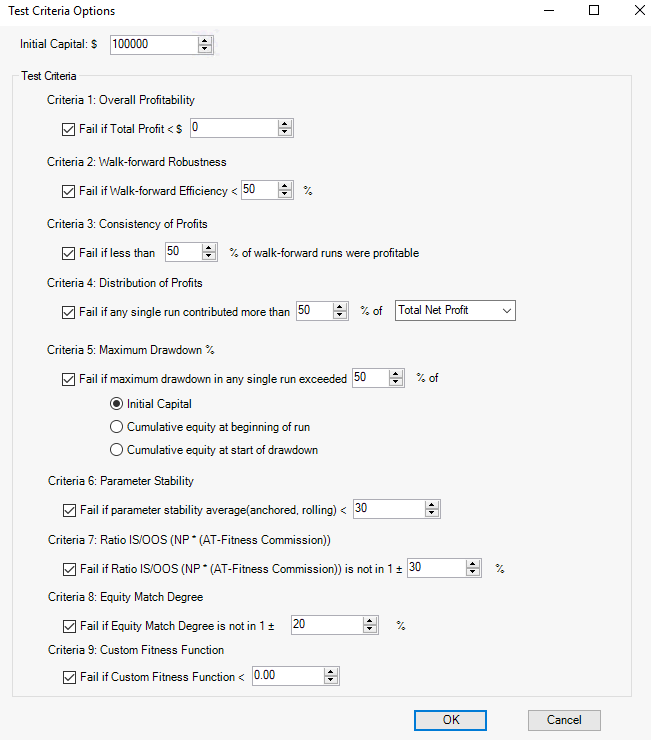
Test Criteria.
This is the recommended settings, but this is only a rough guideline.
1) Each WF run should be profitable. I higher figure than 0 can be used.
2) Walk forward efficiency should be >60. See efficiency to see how this is calculated.
This is considered a measure of robustness.
3) 8 out of 10 WF runs should be profitable.
4) None of the runs should contribute more than 50% of total profit.
5) Fail if maximum draw-down of any run > 25% of initial capital. You may need to adjust the initial capital figure to be appropriate to the position size and contract used.
6) High parameter stability indicates the parameter range is robust and consistent performs. This metric will work poorly if rolling walk forward is done.
Anchored parameter stability is looking for the final parameters to be as close as possible to all previous parameters.
Rolling parameter stability is looking for each parameter set to be as close as possible to the previous parameter set.
This also will give a slightly favorable bias to systems with fewer parameters.
See this link, its in GSB but the same concept is used in EWFO.
7) Ideally the ratio of in sample vs out of sample net profit should be +-20%. This figure may be too low.
Keep in mid if optimizing a system gives a great variation in the number of trades, this goal is less likely to be achieved.
8) If the parameters vary, but the in sample and out of sample curves are very similar, this is a good thing. It means variation in parameters doesn't cause significant
variation in equity curves.
9) If whatever EWFO has used for fitness, is less than this value, then the test will fail.
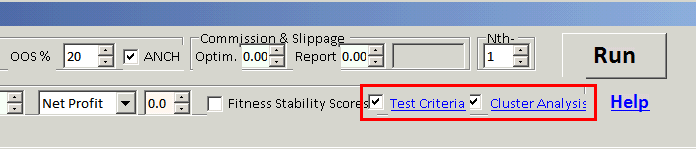
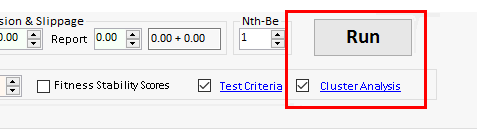
To adjust the Test Criteria / Cluster Analysis, tick the box and click on the appropriate word.
Cluster Analysis
The amount out of sample % and number of runs can be set here. Also anchored and rolling can be chosen.
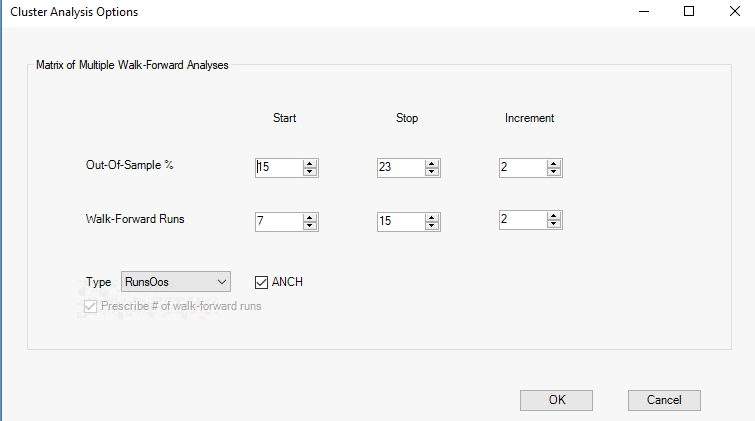
Perform a cluster analysis after hitting the run button with cluster analysis box ticked.
Note that it will be time consuming as in the example above, 20 separate walk forward runs need to be done.
Analysis of the results
The cyan box below shows the reasons for cluster failure. The metrics shown likely are unrealistically high goal to achieve.
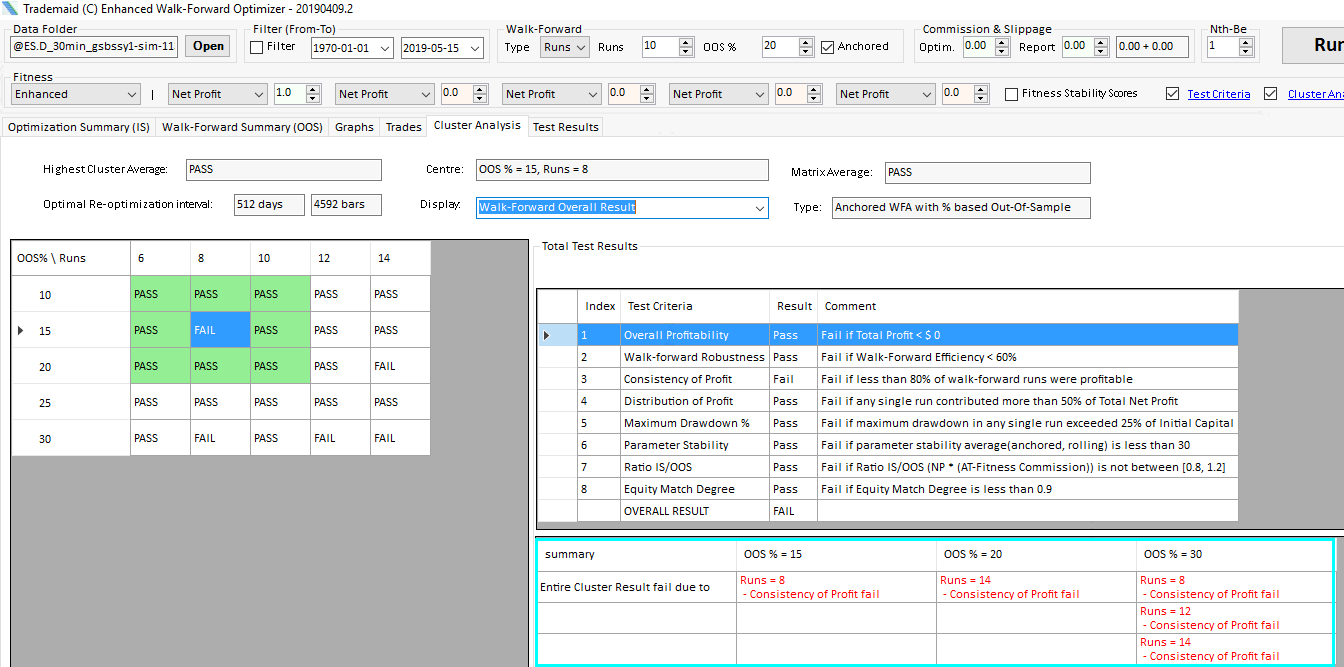
The reason why these goals may be unrealistic is market conditions during certain periods were simply not suitable for trading profitably.
See the red boxes below.