Improved Repeatability Method
Feature is new in 2023.08.08.1 build of GSB Automation.
High level conclusion.
GSB results are not as repeatable doing identical tests as what we have assumed. Repeatability is inversely proportional to the amount of indicators,
however on the Gold setup results improved with more indicators.
A short cut also dramatically reduced the amount of iterations needed almost by half. This will be explained here.
Details.
GSB is often testing our assumptions. This is good as if our assumptions are wrong, this ultimately will affect profitability negatively.
I am following James Clear (from the book Atomic Habits) idea, that large improvements can be made by cumulative smaller improvements.
If the small improvements are statistically as small as the variation in the identical tests used, our logic is flawed.
The assumption is when we build 4 lots of 10,000 systems, make a change in setup (IE session time, time of day, secondary filter, adding data 2 etc ) and compare to a second test of 4 lots of 10,000 systems is that the change in results will show the effect of the change in setup.
The assumption here is that GSB results are repeatable within very close variation. If the variation is too large, this will also lead you to thinking that a change in your setup has improved your setup, when it was really just an element of randomness.
What my tests showed is that repeatability is inversely correlated to the number of indicators we used.
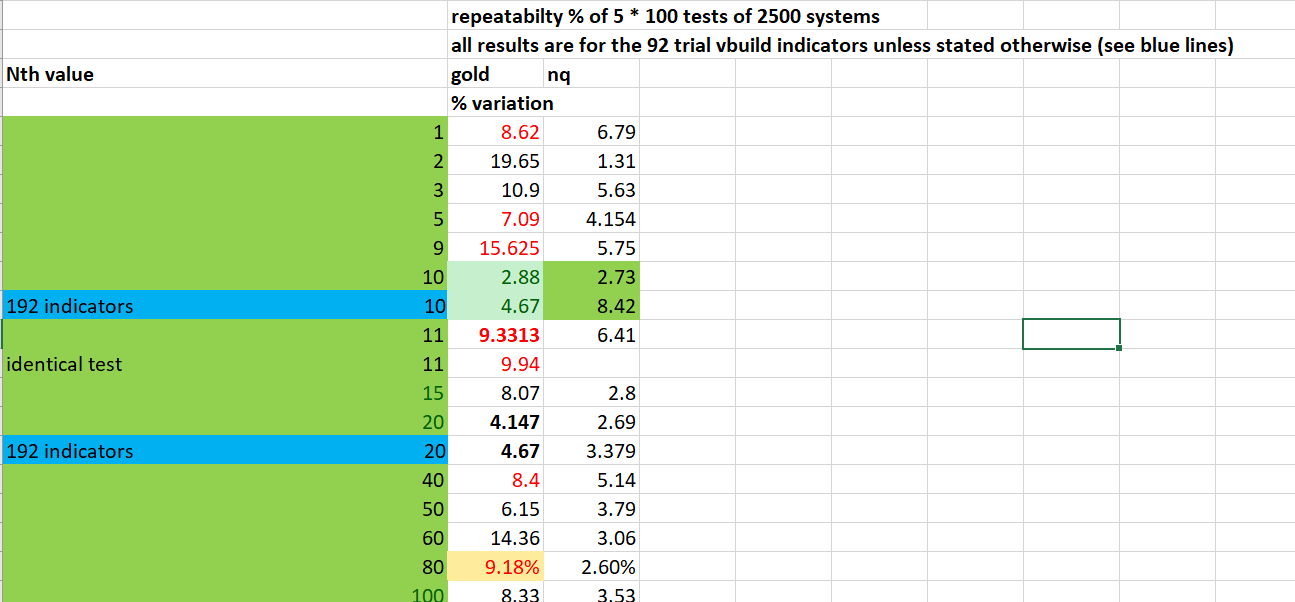
With 100 tests of 2,500 systems repeatability was within 4.7 % after 100 tests using 82 indicators, with each test being repeated 7 times.
This is not great, in that this means unless we get improvement in results > 4.7 %, we cant be sure that changes to our setup conclusively improved things.
Filtering that removed all results that were outside 2 standard deviations was used. This is a new feature in the GSB automation spread sheet version 64 on-wards that is found in GSB Automation's purchasers pcloud folder.

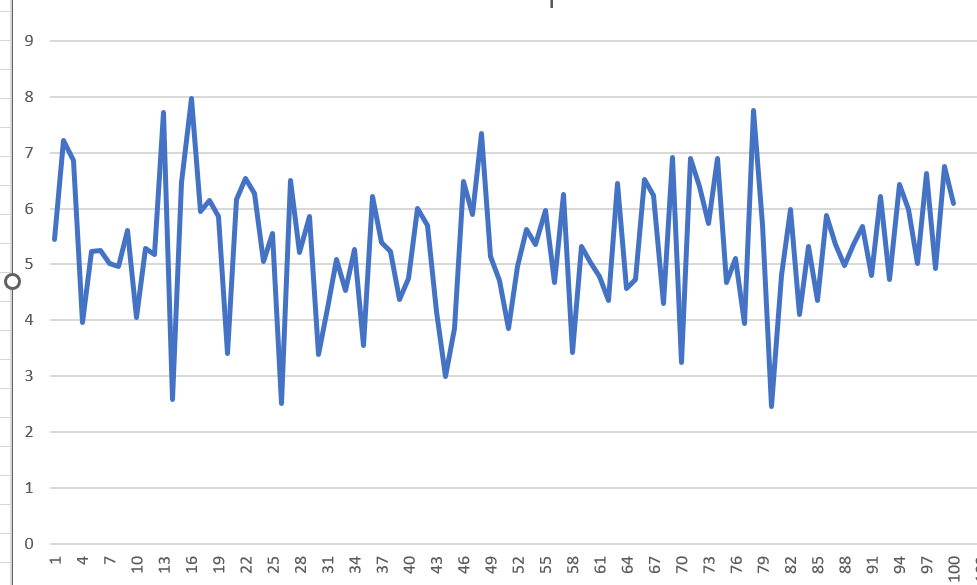
With 192 indicators (many not released yet) I was getting 6.2% variation in 2 groups of 100 tests. Likely this figure would be much higher if more tests were done. This is simply too large a variation when looking for small improvements to your GSB trading setup.
If we used more that 2500 systems, IE 50,000 out of sample results were only a little better, and I don't have the CPU resources to test this in greater detail.
These results of course will vary per market, and setup but at least give us a possible expectation in range of variations.
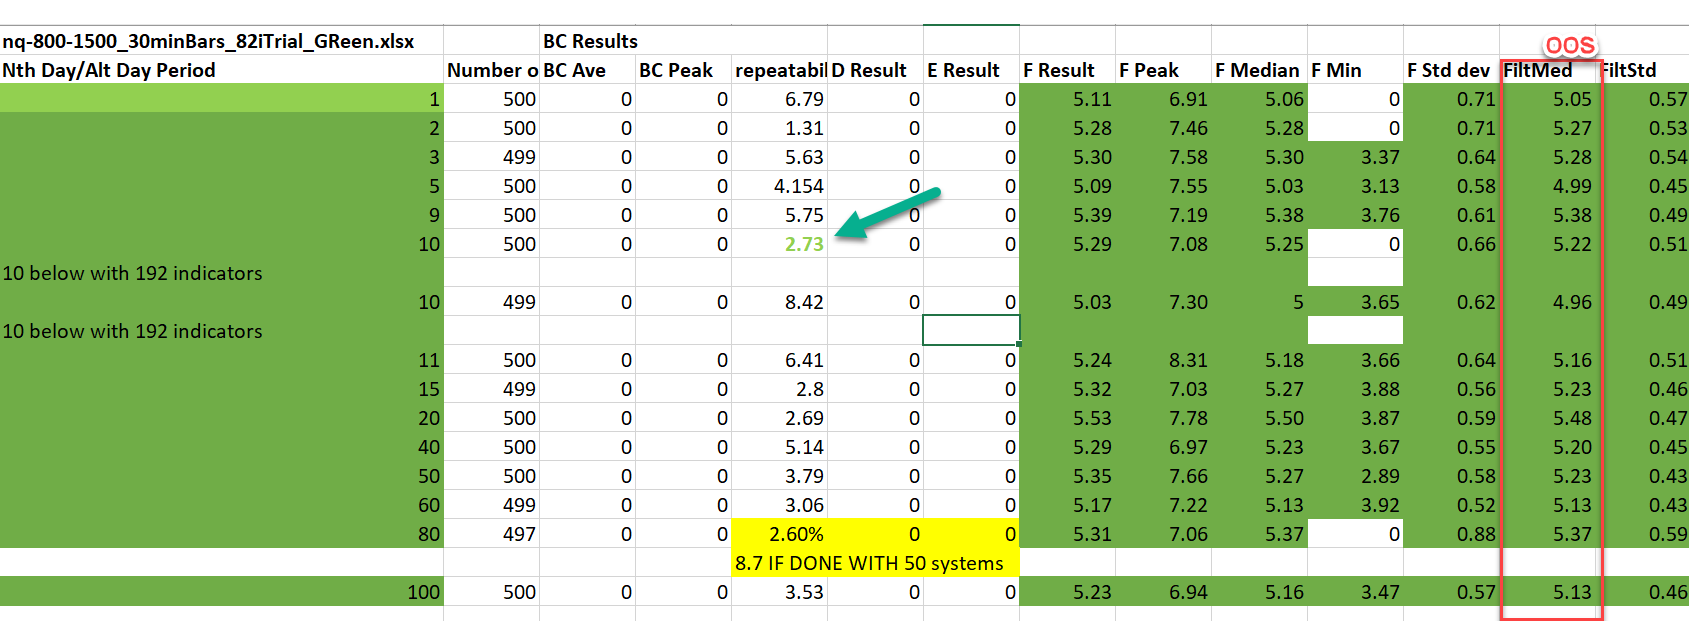
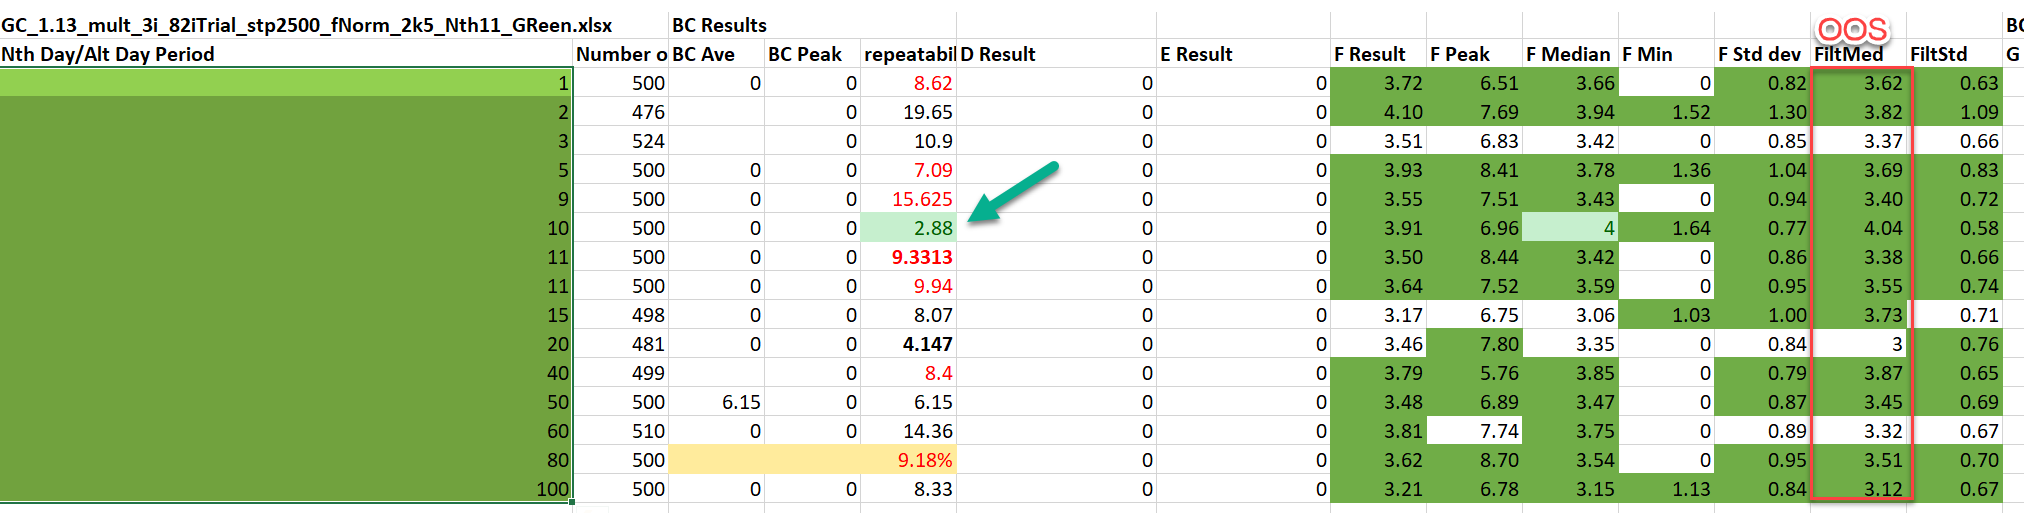
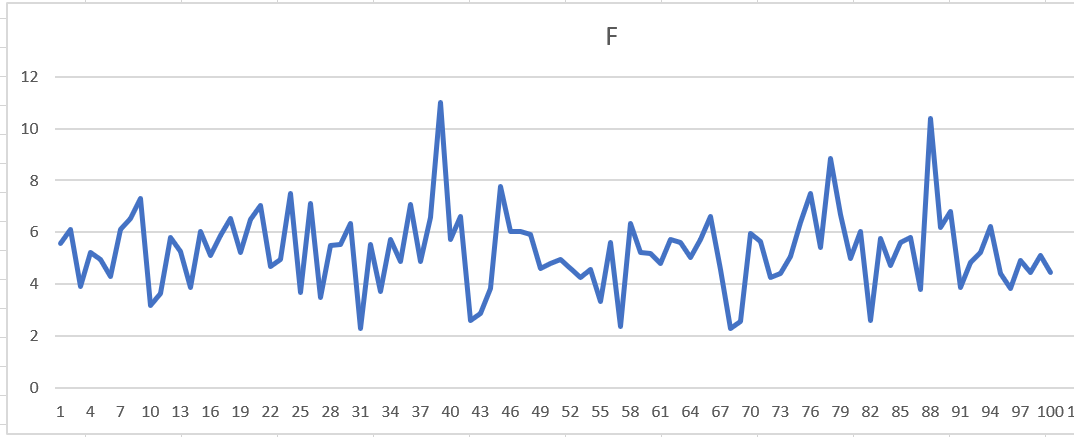
Here are 2 examples of the results in coulomb F (Out of sample NP/DD) using 192 indicators.
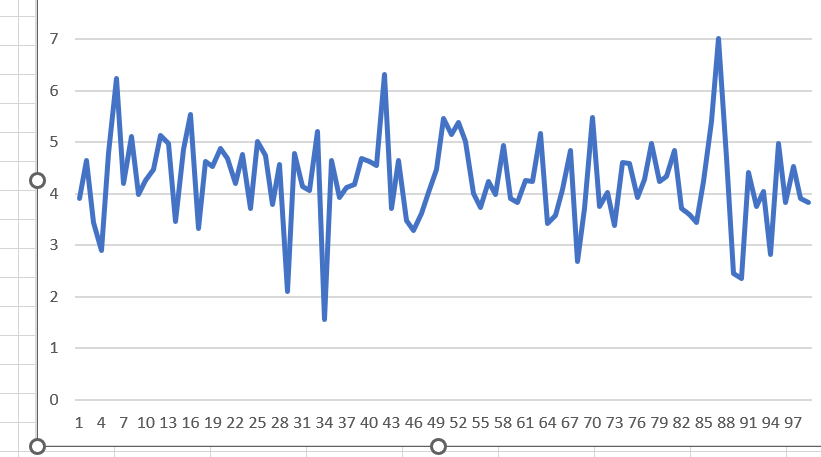
Results below are with 82 indicators trial user. Overall more consistent, but note the results are lower than with 192 indicators. This clearly showed the 192 indicators are worth using.
New branch in the GSB methodology.
In summary I want to split the methodology into a branch of two sections.
The new excel spread sheet (version 64.1 or later) should be used that used median instead of average for coulomb (Np/dd) for out of sample results.
See the new sort tab.
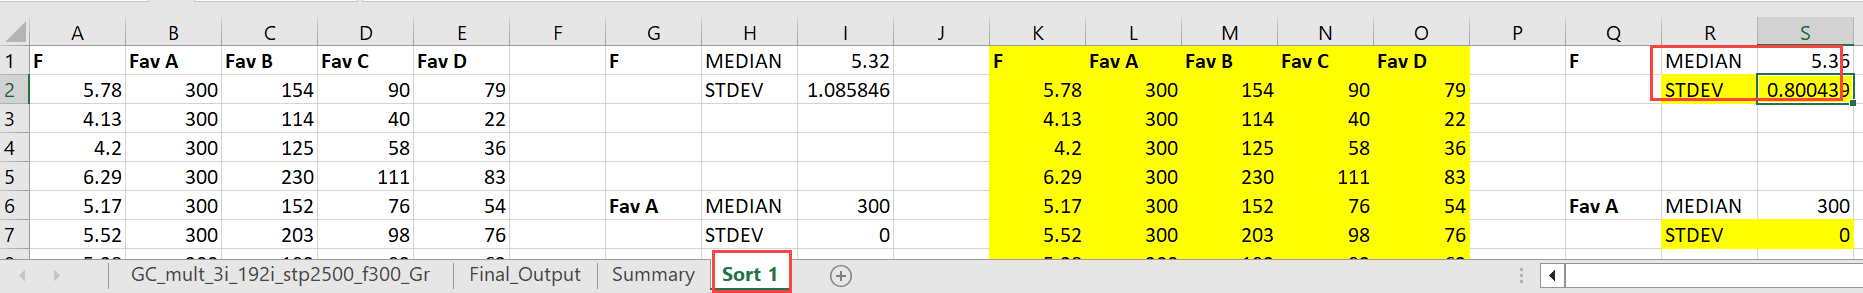
Median and using standard deviation filter gave significant improvement in consistency compared to average.
For both methods, use the August 18 short cut method.
Use current older methodology when
1.i building systems to trade and market is well known.
1.ii Looking for high level exploration of a new market, when big variation is expected from one test to another. IE different secondary filters on each market.
Update August 18 2023. Do not use the new green 10 macro. (Wrong conclusions that this macro is good due to human setup error.( In sample was out of sample))
Use 2023 August methodology when
2) looking for small improvements.
Update August 18 2023. Do not use the new green 10 macro. (Wrong conclusions that this macro is good due to human setup error.( In sample was out of sample by mistake))
Optional, especially if you are low in CPU power. Used the trial reduced indicator set of 82 indicators. The exact reduced indicator set may be tweaked over time.
This CSV list can be imported directly into GSB.
If CPU usage and time permits, do 50 but preferably 100 tests of 2,500 systems.
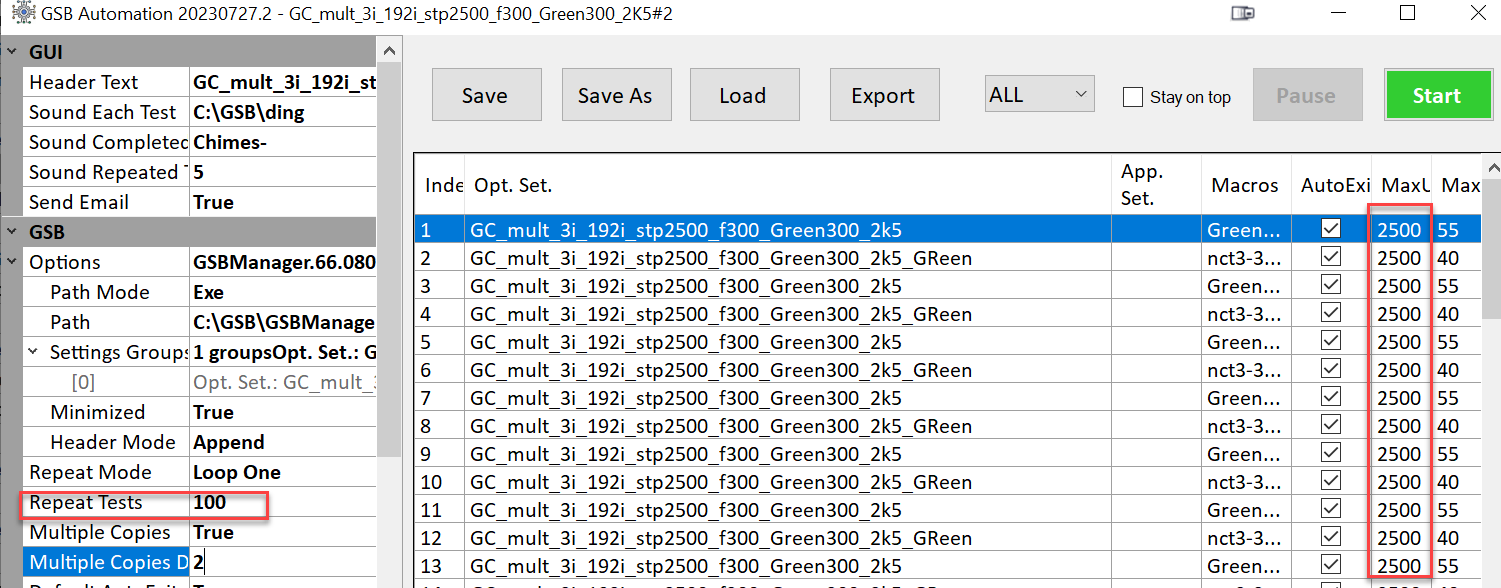
Here are the settings in GSB Automation.
New Short cut method. (August 18 2023)
This gives a 50% decrease in the amount of CPU time needed, with no significant negatives.
Full details see here.
SUMMARY OF NTH TESTING (August 22 2023 update)
Using the 500 * 2500 tests short cut method of 2 builds of systems per one indicator build,
using 82 trial mode indicators - nth mode 10 clearly is best on both NQ and GC as far as repeatability of results.
On NQ out of sample results were consistent regardless of nth value.
On GC results were more erratic according to nth value with no clear pattern, however nth 10 was among the best
repeatability of one lot of 100 tests were all within 3% of each other with 87 indicators, nth 10.
With 192 indicators (more that whats released even to beta users) repeatability was 4.67% for gold and 8.42 for NQ
thanks greatly too all those who contributed CPU power to this project. Likely the most CPU intensive project I have done. Really tedious to do the research but exciting with the end result.
Summary or results