System statistics - degradation
We can now measure the degradation of each individual system.
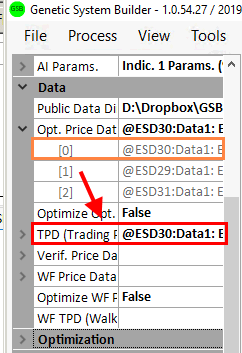
To use only one frame to do stats on, IE the 30 minute if you use 29,30,31 you will be asked, use TPD data.
Select yes. Before this make sure the TPD is the central time frame. See below.
The original In-Sample results use to compare with out of sample results, are always loaded automatically when the system is built.
Later build of GSB will allow options to reset this. 54.27 rest will only reset the OOS (Out of sample) data stats, not the IS (In sample) data stats.
We could use statistics as follows.
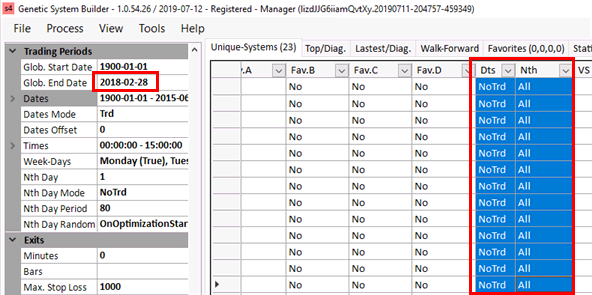
Build systems with nth set to no trade, but (under app settings) nth set to trade. See below picture.
Dates & Global dates to 2000-1-1 to 2015-6-30
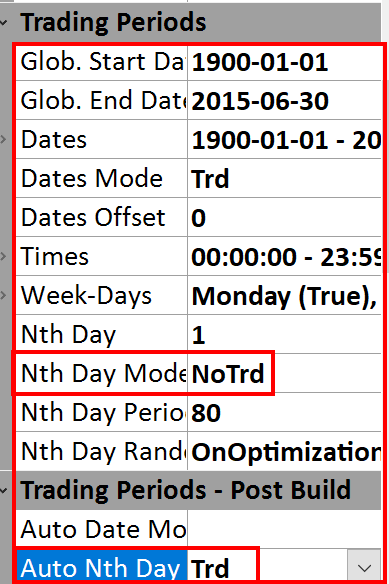
This means a system will be build with Nth set to no trade, (The IS) but arrive in the manager as Nth set to trade.
So what you see in the manager is the Nth OOS. This feature has moved into the left most section of GSB
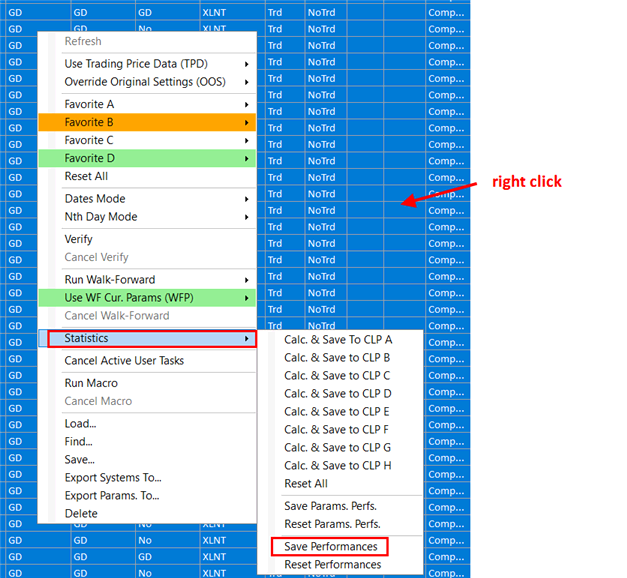
You can then right click and load the OOS results into statistics.
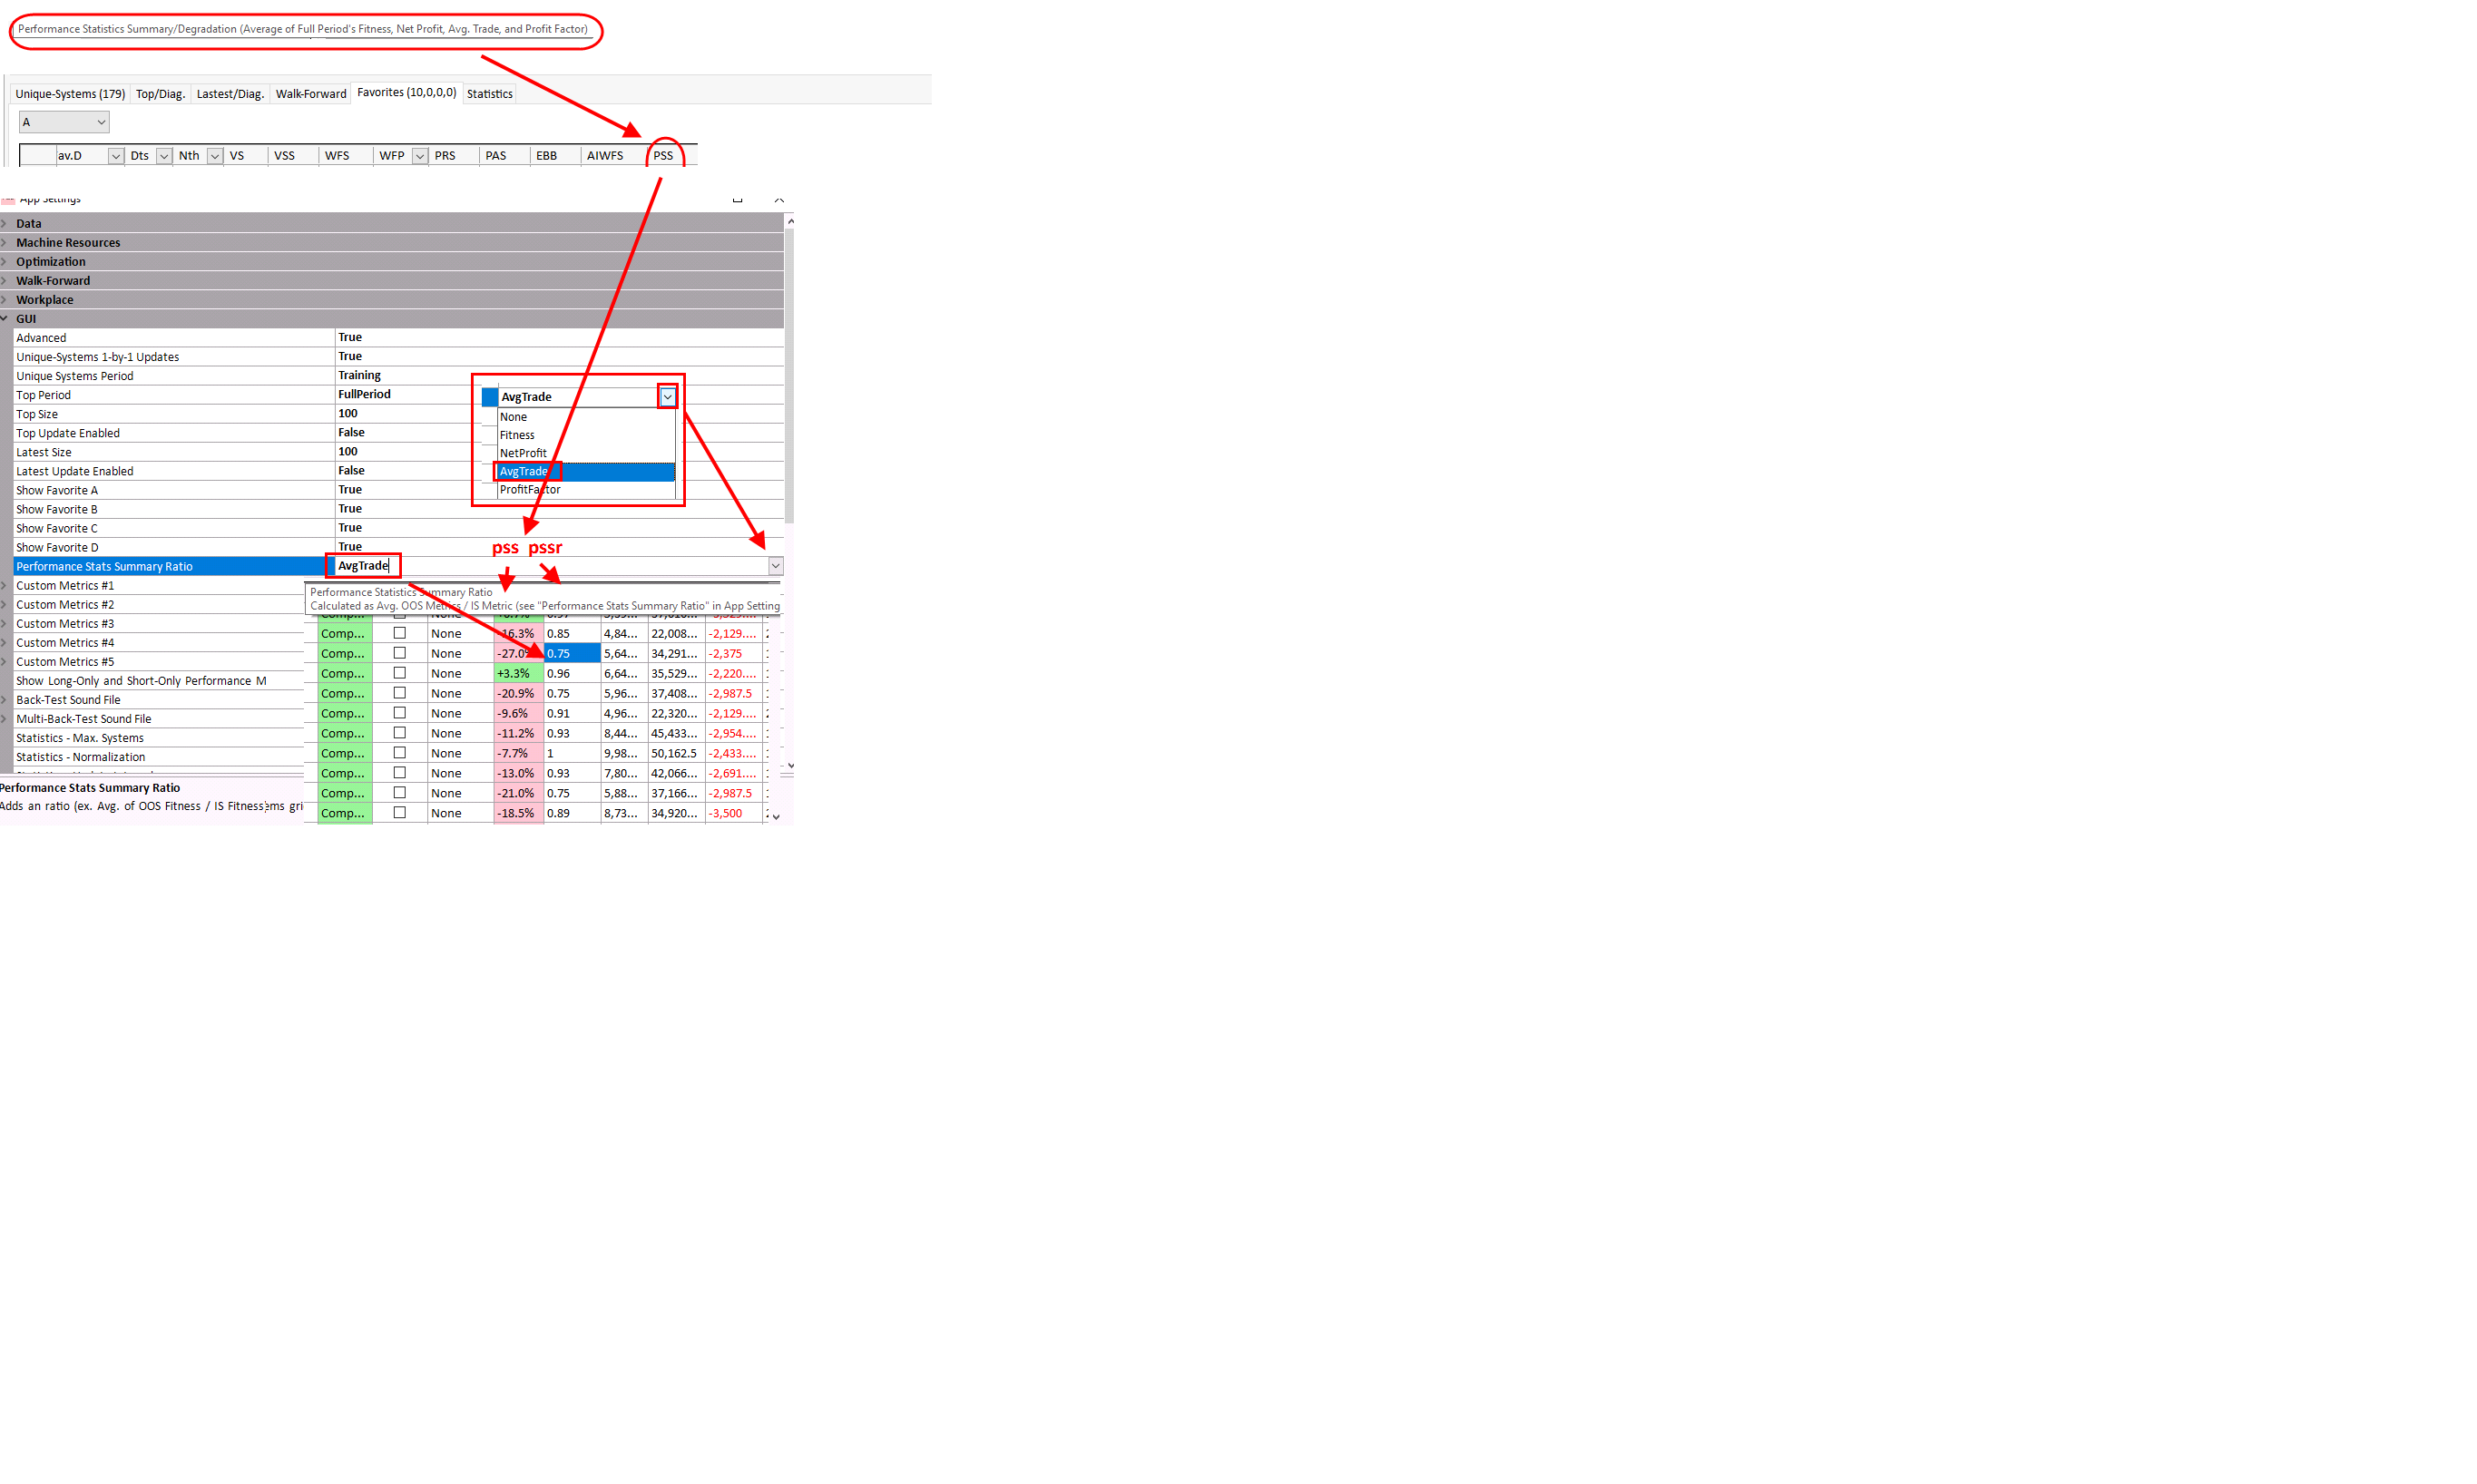
The results are shown in the PSS coulomb.
Custom PSS can also be programmed.
See below.
You could now change the Global dates to 2018-2-28, leave dates as is, change Nth to ALL and dates set to no trade.
This will give an additional OOS period from 201507-1 to 2018 2 28
You can right click and load into performance stats. This will then give the stats of the same in-sample, but include out of sample from both the OOS periods.
(The OOS period is 2000 to 2015 06 30 nth trade & 2015 7 1 to 2018 2 28)
The results of multiple OOS period are normalized according to how many days trading occurred.
So if one OOS period is 1 year, and the other OOS period is 2 years, then more weight will be used on the 2 year period than the 1 year period.