Report Navigation
Report Navigation
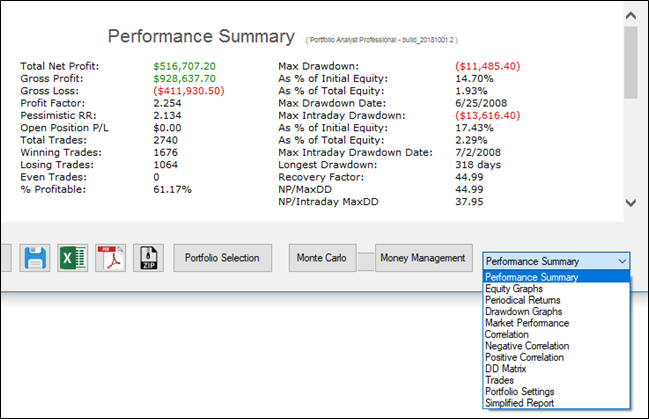
You can navigate all the different part of the report from the derp down menu here. All the report that you can generate are as follows –
- Performance Summary – A quick overview of the Performance of the Portfolio
- Equity Graphs – Give you the graphical presentation of Daily Equity, Closed Trade Equity, Open Trade Equity, Net Profit per Month of Year, New Profit per Week of year, Net Profit per day of Week, Accumulative Monthly Net Profit, Distribution of Monthly Profit, Daily Margin To Equity Ratio, Daily Margin To Initial Capital Ratio, Daily Margin.
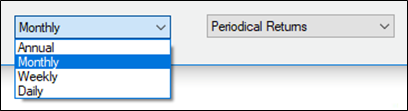
- Periodical Returns – Annual – Shows yearly return parameters in default. You can change it to Monthly, Weekly or even Daily.
- Drawdown Graphs – Shows the Drawdown in the Graph. It has Daily Drawdown, Daily Net Profit & Drawdown, Closed trade Drawdown, Intraday Drawdown, Drawdown Depth Distribution, Drawdown Length Distribution, Closed Trade Drawdown of Each System, Intraday Trade Drawdown of each System, Contribution of Each system to Max Drawdowns, Contribution of Each System to Average 5 Worst Drawdowns
- Market Performance – Shows all the different instruments performance individually.
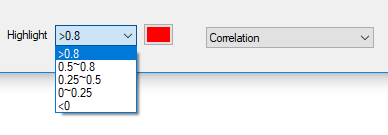
- Correlation – It shows the Correlation of Monthly returns per strategies. You can color them in basis of range. Available ranges are –
- Negative correlation – Shows Negatively Correlation of each strategy in Daily, Weekly and Monthly frame. Again you can color them according to value ranges.
- Positive correlation – Shows Positive Correlation of each strategy in Daily, Weekly and Monthly frame. Custom color is available with the specific value ranges.
- DD Matrix – Shows Correlation of Equity DD Lines.
- Trades – Shows all the trades from all the system. Trades can be exported in different format available.
- Portfolio Setting – Show the setting of the Portfolio
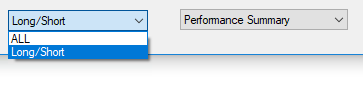
- Performance Summary – Shows a quick Summary report. You can also get the report based on Long/Short trade.