Folder: “Walk-Forward Summary (OOS)
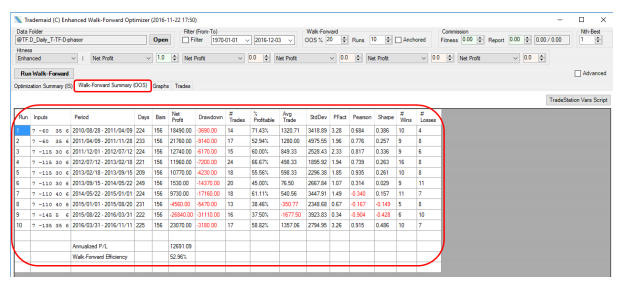
The Optimization Summary (OOS) shows reports about all Out-Of-Sample (OOS) runs:
- Run: The total number of runs is determined by the field “Runs” in the EWFO control input.
- Inputs: The best values for the parameters being optimized was determined during the insample run (see Optimization Summary(IS). These best parameter settings are used for the OOS run.
- Period: This is the OOS period of the run. The Start of the OOS-period coincides with the corresponding run of the end of the IS period.
- Days: number of Calendar-days of the OOS run
- Bars: number of bars of the OOS run
- Net Profit: Net Profit of the OOS run
- Drawdown: biggest Drawdown during the OOS run
- # of Trades: Number of Trades during the OOS run.
- % Profitable: Percent of trades which were profitable during the OOS run
- Avg Trade: The average trade in of the OOS run (this includes the reporting commission).
- StdDev: Standard Deviation of all trades during the OOS run.
- PFact: Profit Factor during the OOS run
- Pearson: Pearson correlation to perfect straight equity line of 45 degree for this OOS run.
- Sharpe: Sharp ratio for this OOS run.
- # Wins: number of winning trades for this OOS run.
- # Losses: number of losing trades for this OOS run.